

2026 mid-year market intelligence report: 5 takeaways for clean energy developers

Share
.svg)

.svg)
.svg)
Want to explore more conversations like this?
View all blogs
The clean energy finance market proved to be remarkably adaptable in the first half of 2026. Developers navigated the One Big Beautiful Bill (OBBB) and its prohibited foreign entity (PFE) rules while preparing wind and solar projects for the July 4 beginning-of-construction deadline to retain production tax credit (PTC) and investment tax credit (ITC) eligibility.
That adaptability is reshaping how developers approach capital. The developers best positioned for the second half of 2026 are treating financing as a full-stack capital problem rather than defaulting to the market they have historically used. Debt, tax equity, preferred equity, and tax credit transfers are increasingly interdependent, with developers moving among them based on which channel offers the clearest path through PFE risk, credit quality constraints, and deal structuring.
Crux's The State of Clean Energy Finance: 2026 Mid-Year Market Intelligence Report shows this shift taking place across a growing market. Despite PFE compliance uncertainty, permitting bottlenecks, and political pressure stemming from rising energy costs, participants learned to price the new risks and continued to put capital to work rather than waiting for Treasury guidance.
- Clean energy and manufacturing capital expenditure reached $74 billion in H1 2026, pacing toward $180 billion for the full year, up from the record $155 billion in 2025.
- Total tax credit monetization is on track to approach $70 billion by year-end, an 11% increase over 2025.
- Debt financing is pacing toward $143 billion, up 19% year over year.
Here is what matters most for developers heading into the second half of the year.
Download the full 2026 Mid-Year Market Intelligence Report for the complete data set behind these findings.
1. The market changed shape, but it didn’t contract
Solar and wind projects faced the heaviest PFE and permitting headwinds in H1 2026. As a result, solar's share of tax credit transfer volume fell to 30% in H1 2026 from 35% a year earlier, and wind fell to 7.5% from 23%. Manufacturing tax credit volumes fell too (to 7.5% of the market from 13%), which aligns with PFE risk tied to 2026-vintage credits.
Transferable Tax Credit (TTC) market composition by tech type, H1 2024–H1 2026
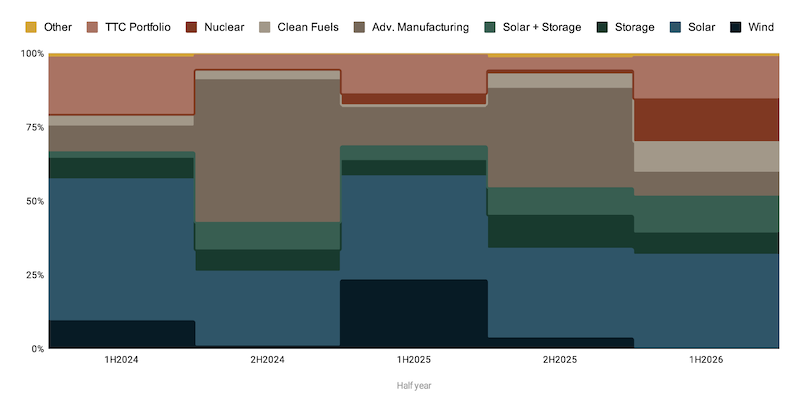
New technology types filled the space solar and wind ceded. Standalone battery storage grew to 7% from 5%, and solar-plus-storage deals grew to 12% from 5% — both tracking record battery deployment in the first quarter. Crux observed $1.7 billion in §45Z clean fuel transactions — more than the $1.1 billion for all of 2025 — driven by limited PFE risk and policy clarifications from Treasury and the US Department of Energy.
2. Capital is available across the full stack
Developers evaluating capital options in H2 2026 have a growing range of financing sources beyond the transfer market. Bridge lending — tax equity bridge loans, transferable tax credit bridge loans, and preferred equity bridge loans — grew to $12 billion in H1 2026, up 10% from H2 2025 and outpacing growth in both construction debt and total greenfield lending. Structures that were largely untransactable a year ago are now clearing at quantifiable premiums: 67% of surveyed lenders said they'd price uncommitted transferable tax credit bridge loans, and 79% said they'd price preferred equity bridge loans backed by a sub-investment-grade investor.
Tax credit monetization by segment, by year, 2025–2026
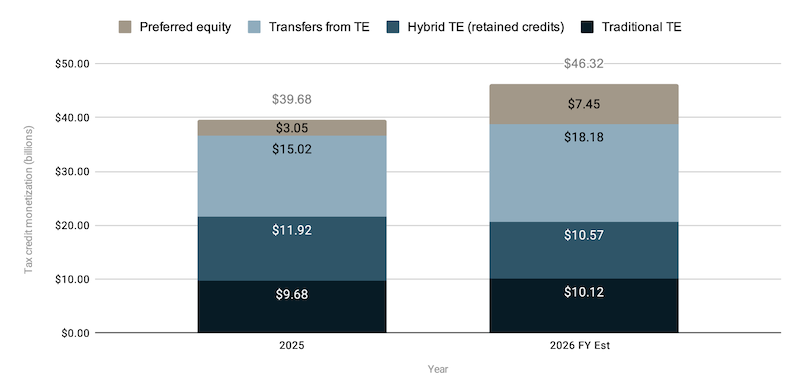
Preferred equity is the standout on the equity side, on pace to more than double in 2026 to $7.4 billion from $3.0 billion in 2025. Large providers of tax equity aren't uniformly comfortable with tech-neutral tax credits, particularly §48E, due to lingering uncertainty around PFE compliance — though willingness to invest is expanding. Preferred equity investors are generally more able to invest in §48E projects, making them a competitive source of capital for a growing share of the market. Crux estimates that total tax equity and preferred equity investment will reach $46.3 billion in 2026 — up 17% from $39.7 billion in 2025. Hybrid tax equity structures, meanwhile, dominated tax equity deal volume and will account for an estimated $28.8 billion in 2026.
3. PFE risk is the dominant force shaping the tax credit market
PFE risk overtook both deal size and investment-grade (IG) seller status as the dominant factor in tax credit pricing — the single biggest shift in H1 2026. Deal size and seller status still matter, but whether PFE rules apply substantially reduces their influence on a tax credit deal. Tax credits subject to PFE rules still transacted in H1 2026, but successful deals relied on the seller's ability to make durable indemnities supporting their tax credit.
Market-wide average pricing declined to $0.913 for 2026 ITCs and $0.930 for PTCs, below typical historical ranges of $0.920–0.925 for ITCs and $0.940–0.950 for PTCs. That discount shows up in two separate premiums:
- Non-PFE premium: Legacy §48 and §45 tax credits — from projects that began construction before January 1, 2025, and are therefore exempt from PFE rules entirely — commanded premiums of $0.015 (ITCs) and $0.020 (PTCs) over PFE-exposed tax credits.
- Seller-quality premium: The premium buyers pay for an IG seller compressed to roughly $0.015 in H1 2026, down from $0.030 in 2025.
The H1 2026 pricing discounts trace to unresolved risk, not weak demand. Whether they unwind in H2 depends on the pace of Treasury guidance on PFE ownership and effective control, expected later this year. Until that guidance lands, tax credit insurance still doesn't cover most PFE risk, and a growing share of policies are pricing at 5%+. Once insurers get IRS guidance and grow comfortable pricing PFE risk directly, coverage and cost will likely improve.
The report flags a specific tactic sellers are already using: pooling PFE-exposed tax credits with legacy tax credits or clean fuel tax credits that carry no PFE risk into a single large transaction — sometimes called a “ladle-dip” — to diversify risk.
4. What the July 4, 2026 safe harbor deadline means for developers now
The July 4, 2026, safe harbor deadline for §45Y/§48E wind and solar eligibility has passed, and Crux estimates that developers safe-harbored more than 170 GW of wind and solar capacity before the deadline. Crux’s survey data shows this wasn't a last-minute scramble — most of the market saw the deadline coming and pre-positioned their development pipeline well in advance. That harbored capacity, plus continued tax credit eligibility for storage and other technologies, gives the market a stable foundation for investment over the next several years.
Impact of ITC and PTC on solar and wind energy costs, 2026
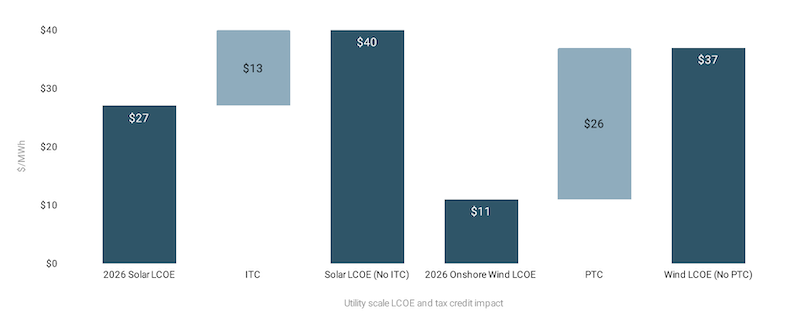
For developers who cleared that bar, the deadline that actually matters now is the one further out: safe-harbored projects that began construction before July 4 only retain PTC/ITC eligibility if they're placed in service by 2030. Annual capacity additions are projected to taper from more than 110 GW in 2027 to 98 GW in 2030, as safe-harbored solar works through that effective placed-in-service deadline and battery storage takes over as the primary driver of new capacity.
Some of that shift is already showing up in the data: 32% of surveyed market participants cited a move toward storage development to access §48E, tracking the broader diversification in project technology mix Crux expects through the rest of the decade.
5. Data centers are reshaping where and how developers build
AI infrastructure is now the primary driver of electricity demand growth. For PJM — the grid operator for the mid-Atlantic and parts of the Midwest — data centers account for more than 90% of projected load additions between 2024 and 2030. For ERCOT, Texas’s grid operator, they make up almost 80% of the load interconnection queue.
Federal and state regulators are aiming to combat affordability concerns driven by that load growth by promoting faster interconnection for projects that can reduce their consumption — either with onsite generation or flexible operations — during times of peak demand. On June 18, the Federal Energy Regulatory Commission (FERC) ordered all six major regional electricity markets to justify or revise their rules for studying, interconnecting, and providing transmission service for data centers and other loads over 50 MW. Texas regulators approved similar rules the same day — both aimed at speeding up interconnection in exchange for flexible operations. This likely creates opportunities for late-stage solar and battery projects via around-the-clock energy prices.
Rising off-peak demand from data centers is also likely to continue to increase energy prices. The report projects hours clearing above $250/MWh in PJM rising from roughly 45 in 2025 to more than 280 by 2030, and in ERCOT from about 13 to more than 480 — a dynamic the report expects to improve project economics for solar and storage specifically.
Separately, demand signals from creditworthy hyperscaler offtakers are giving developers the backing to build larger projects, and a growing track record of completed financings empowers lenders to price risk more effectively, expanding the capital pool available to support larger deals. These factors are driving project-scale growth and point to a market that is ready to build.
That said, this growth isn't guaranteed. Permitting and regulatory uncertainty — for both power generation and data center projects — could put larger-scale projects at risk amid political pushback over energy affordability. New York and Texas have both paused new data center approvals pending investigations into power consumption and grid impacts, and lawmakers in nearly 30 states introduced bills this session to scale back data center tax incentives.
What's next for clean energy developers in 2026
Crux's supply forecast projects tax credit supply holding above $75 billion annually through 2030, with battery storage and §45X manufacturing tax credits growing to nearly two-thirds of total supply by then. With electricity demand rising and energy supply constraints putting pressure on costs, efficiently financing new generation, storage, and domestic manufacturing offers a path toward greater energy affordability and security.
The financing mix will keep shifting as PFE guidance evolves, new technologies claim a larger share of tax credit supply, and investors price risk differently across debt, tax equity, preferred equity, and tax credit transfers. Developers that can move across those markets will have more options to finance projects and put capital to work.
Crux sees all these markets from the inside and helps price credit quality and structure into transactions across each of them. If you want to talk through how these dynamics apply to your pipeline, reach out to our team.
Read the full report: The State of Clean Energy Finance: 2026 Mid-Year Market Intelligence Report
Share