

What does it take to get clean energy financing in 2026?

Share
.svg)

.svg)
.svg)
Want to explore more conversations like this?
View all blogs
Clean energy lending is growing in 2026. But more capital does not mean every project has equal access to it.
Lenders are concentrating on lower-risk opportunities, including experienced sponsors, established technologies, stable offtake, and increasingly larger transactions. Projects with more complicated risk profiles may still find financing, but often from a different set of capital providers, at different leverage levels, or with different pricing.
For developers and project sponsors, what matters is what makes a project attractive to lenders and which risks lenders will price versus avoid altogether.
What does the clean energy lending market look like in 2026?
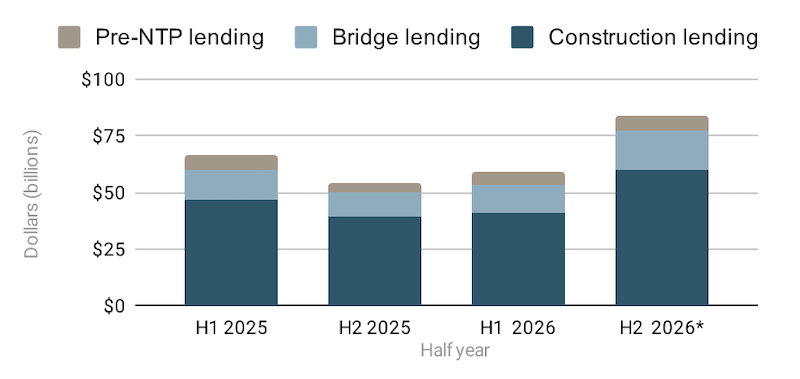
Lending activity rebounded in the first half of 2026, with power projects driving much of the growth. Here's what the debt stack looked like in the first half of 2026 according to Crux’s Mid-Year Market Intelligence Report:
- Greenfield debt financing reached $59 billion, up 12% from $53 billion in the second half of 2025. Crux projects $143 billion for the full year, a 19% increase over 2025.
- Construction lending, the largest piece of the debt capital stack, totaled roughly $41 billion.
- Bridge lending reached roughly $12 billion, the fastest-growing debt category.
- Pre-notice-to-proceed (pre-NTP) capital totaled roughly $6 billion.
- Within construction lending, power accounted for 82% of activity, and utility-scale solar plus battery storage made up 69% of power-sector construction debt.
Total greenfield debt financing by instrument, H1 2025 - H2 2026
Download the full 2026 Mid-Year Market Intelligence Report for the complete dataset behind these findings.
Capital is plentiful, but it's concentrated in particular technologies, sponsors, and risk profiles. Developers preparing to raise debt should understand that what lenders are underwriting can be as important as where pricing sits.
What are lenders actually underwriting right now?
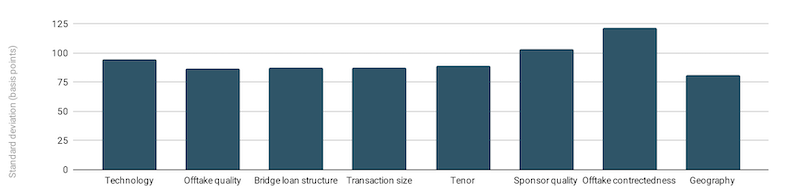
Crux surveyed 50 project finance lenders in the second quarter of 2026 to identify and quantify the key risk factors impacting the cost of bridge loan financing. Sponsor experience, takeout contractedness, and investor and buyer credit quality were the most impactful drivers of pricing differentiation. Pre-NTP financing shows a similar pattern: for experienced, investment-grade sponsors, indicative spreads increase materially as the share of operating assets in a portfolio declines.
Standard deviations of bridge loan pricing quotes by select factors, Q2 2026
Sponsor experience matters
An experienced sponsor with a history of developing and operating similar assets can give lenders more confidence that a project will reach its milestones. A less-established sponsor may need to compensate for a shorter track record through additional equity, stronger counterparties, or other structural protections.
The pre-NTP market shows the same dynamic. Even among experienced, investment-grade sponsors, lenders indicated higher spreads for portfolios with a lower share of operating assets.
Contractedness and offtake quality matter
Lenders showed some of their greatest pricing variation when evaluating offtake contractedness. In some scenarios, quotes for the same project differed by more than 100 basis points.
Revenue certainty can also affect leverage. Crux found debt service coverage ratio (DSCR) requirements ranging from 1.20x for fully contracted projects using established technologies to 2.00x for projects with meaningful merchant exposure and less-established technologies.
For developers, contractedness can influence both the price of debt and how much debt a project can support.
Sponsor equity can become a gating issue
Sponsor equity requirements vary sharply by technology: 10–20% for utility-scale solar, C&I solar, residential solar, and battery storage; 20–30% for RNG, advanced manufacturing, critical minerals, and geothermal.
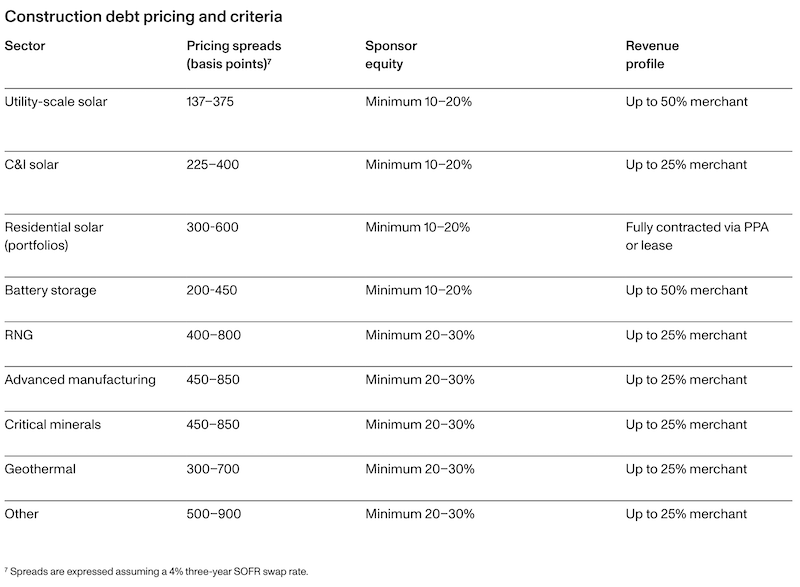
Higher equity requirements can create a meaningful funding gap for developers. Hard-to-price risks, such as extreme weather events or wildfire smoke affecting solar output, can be bigger drivers of higher equity requirements than deal size or technology type. The more clearly a project can identify, quantify, and allocate a risk to the party best positioned to manage it, the easier that risk may be for lenders to underwrite.
Why can a good project still be "below mandate"?
Median construction debt deal size increased 18% year-over-year, from $360 million to $426 million, as bank lenders increasingly focus on larger, higher-quality transactions. For developers, that means a fundamentally sound project can still fall outside a lender's mandate purely because of transaction size.
Median construction debt deal size, H1 2024–H1 2026
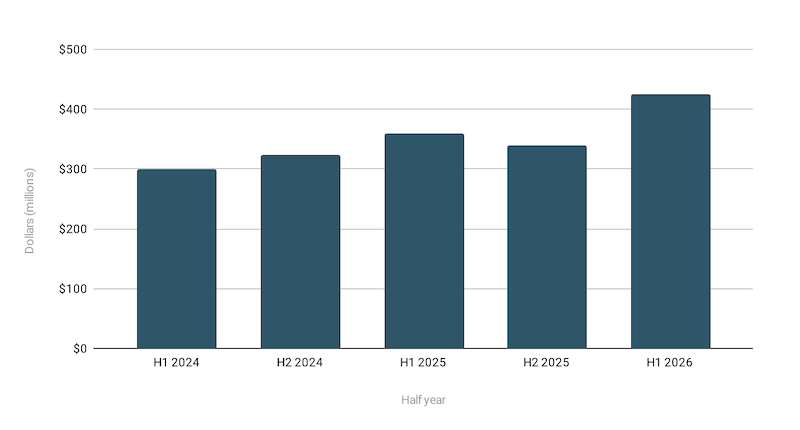
A lender's size mandate can reflect its own operating model, including regulatory capital requirements and internal volume targets. So, a project that falls "below mandate" is not necessarily a project that lenders view as too risky.
Some developers are adapting by aggregating smaller projects into portfolio-level holding company debt structures, creating enough scale to meet larger lenders' requirements even when an individual project would not clear the mandate alone. Preferred equity has also emerged as a path for developers who do not fit the traditional lending box.
Bank debt or private credit: Which is actually cheaper?
The same sponsor, financing the same project, can see materially different economics depending on whether it uses bank debt, private credit, green banks, or mission-driven capital.
Comparing bank debt to private credit means weighing cost against speed together. Bank debt is generally cheaper but slower to put in place; private credit is pricier but can get capital into a deal faster. Given the time value of money, faster capital reaching construction can offset a higher nominal rate.
The lowest headline rate, therefore, is not necessarily the only consideration when developers evaluate financing options.
Want a lender's-eye view of how debt capital markets are shaping up in 2026? Read Crux's roundtable with our lending experts.
Bridge lending is changing how developers think about the full capital stack
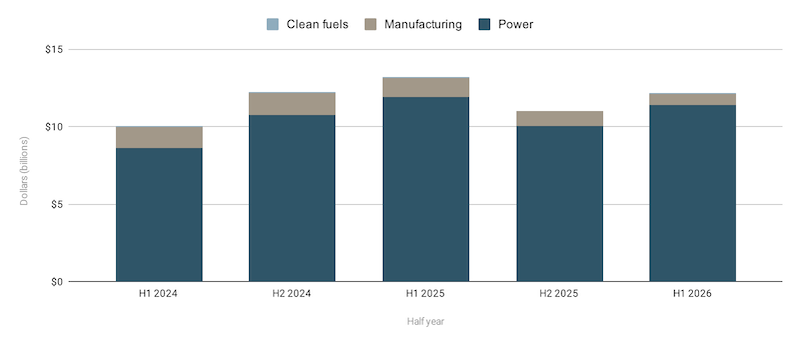
Bridge lending reached about $12 billion in the first half of 2026, up 11% from the second half of 2025, growing faster than both construction lending and overall greenfield debt financing.
Estimated bridge debt financing by segment, H1 2024–H1 2026
Hear the data discussed live: Watch Crux's on-demand webinar on the state of 2026 clean energy finance.
Crux's lender survey also found increasing willingness to finance structures that were previously more bespoke. Sixty-seven percent of surveyed lenders indicated openness to uncommitted transferable tax credit bridge loans, and 79% were open to preferred equity bridge loans involving a sub-investment-grade preferred equity investor.
Bridge structures increasingly connect project debt to other parts of the capital stack, including tax equity, preferred equity, and future transferable tax credit proceeds.
- Tax equity bridge loans (TEBLs) are secured by tax equity commitments.
- Transferable tax credit bridge loans (TRABLs) are repaid using proceeds from the future sale of transferable tax credits.
- Preferred equity bridge loans (PEBLs) are secured by preferred equity commitments and are frequently used alongside tax credit transfers.
These structures are becoming more common and give developers more ways to solve timing gaps across a project's financing. But they also make it harder to treat each source of capital as a separate decision.
A change to the tax equity strategy can affect bridge financing. The timing and certainty of a tax credit sale can affect the debt structure. Preferred equity can fill a funding gap, but its terms may affect what other capital providers are willing to accept.
Developers are increasingly treating financing as a full-stack capital problem for exactly this reason.
What should developers do before going to market?
A growing lending market creates more financing opportunities, but preparation still matters. Developers can take several steps before approaching lenders:
- Allocate project risk before approaching lenders.
Make sure construction, operating, and revenue risks are contractually allocated to the counterparties best equipped to hold them. Projects that struggle to source capital often have a risk that has not been allocated well, rather than simply a size or technology problem. - Start the financing process earlier.
Understand how lenders will view the sponsor, offtake, technology, equity contribution, and takeout before those elements are locked. - Know your likely lender universe.
A project that falls below one lender's mandate may fit another lender's strategy. Identifying the right capital providers early can prevent a sponsor from pursuing lenders unlikely to transact. - Run a competitive process.
Crux saw differences of more than 100 basis points among lender quotes in some scenarios involving sponsor experience and contractedness, showing meaningful variation in how lenders assess identical risks. - Plan the capital stack together.
Debt, bridge financing, tax equity, preferred equity, and tax credit monetization increasingly interact with each other. Decisions about one source of capital can affect the availability and economics of another. - Be diligence-ready.
Expanded underwriting requirements are influencing lender behavior and favoring transactions where information is organized and risks can be evaluated efficiently.
More lending does not mean uniform access to capital
The clean energy lending market has substantial liquidity in 2026, but growing volume doesn't guarantee uniform access to capital. The projects that finance most efficiently are the ones that give lenders clarity — on sponsor capability, contracted revenue, technology risk, equity contribution, and takeout.
Understanding those dynamics early can improve pricing and increase the likelihood that a financing clears the market at all.
Further reading
For a deeper look at how bridge loan structures are priced and repaid, see Crux's guide to tax credit bridge loans.
To understand how tax equity bridge loans differ from the tax credit bridge loans discussed here, read Crux's definitive guide to tax equity bridge loans.
For more on how this data fits into the rest of 2026's market picture, see Crux's five takeaways from the Mid-year Market Intelligence Report.
Share