

Benchmarking F1000 participation in the transferable tax credit market (Q1 2026 update)

Share
.svg)

.svg)
.svg)
Want to explore more conversations like this?
View all blogs
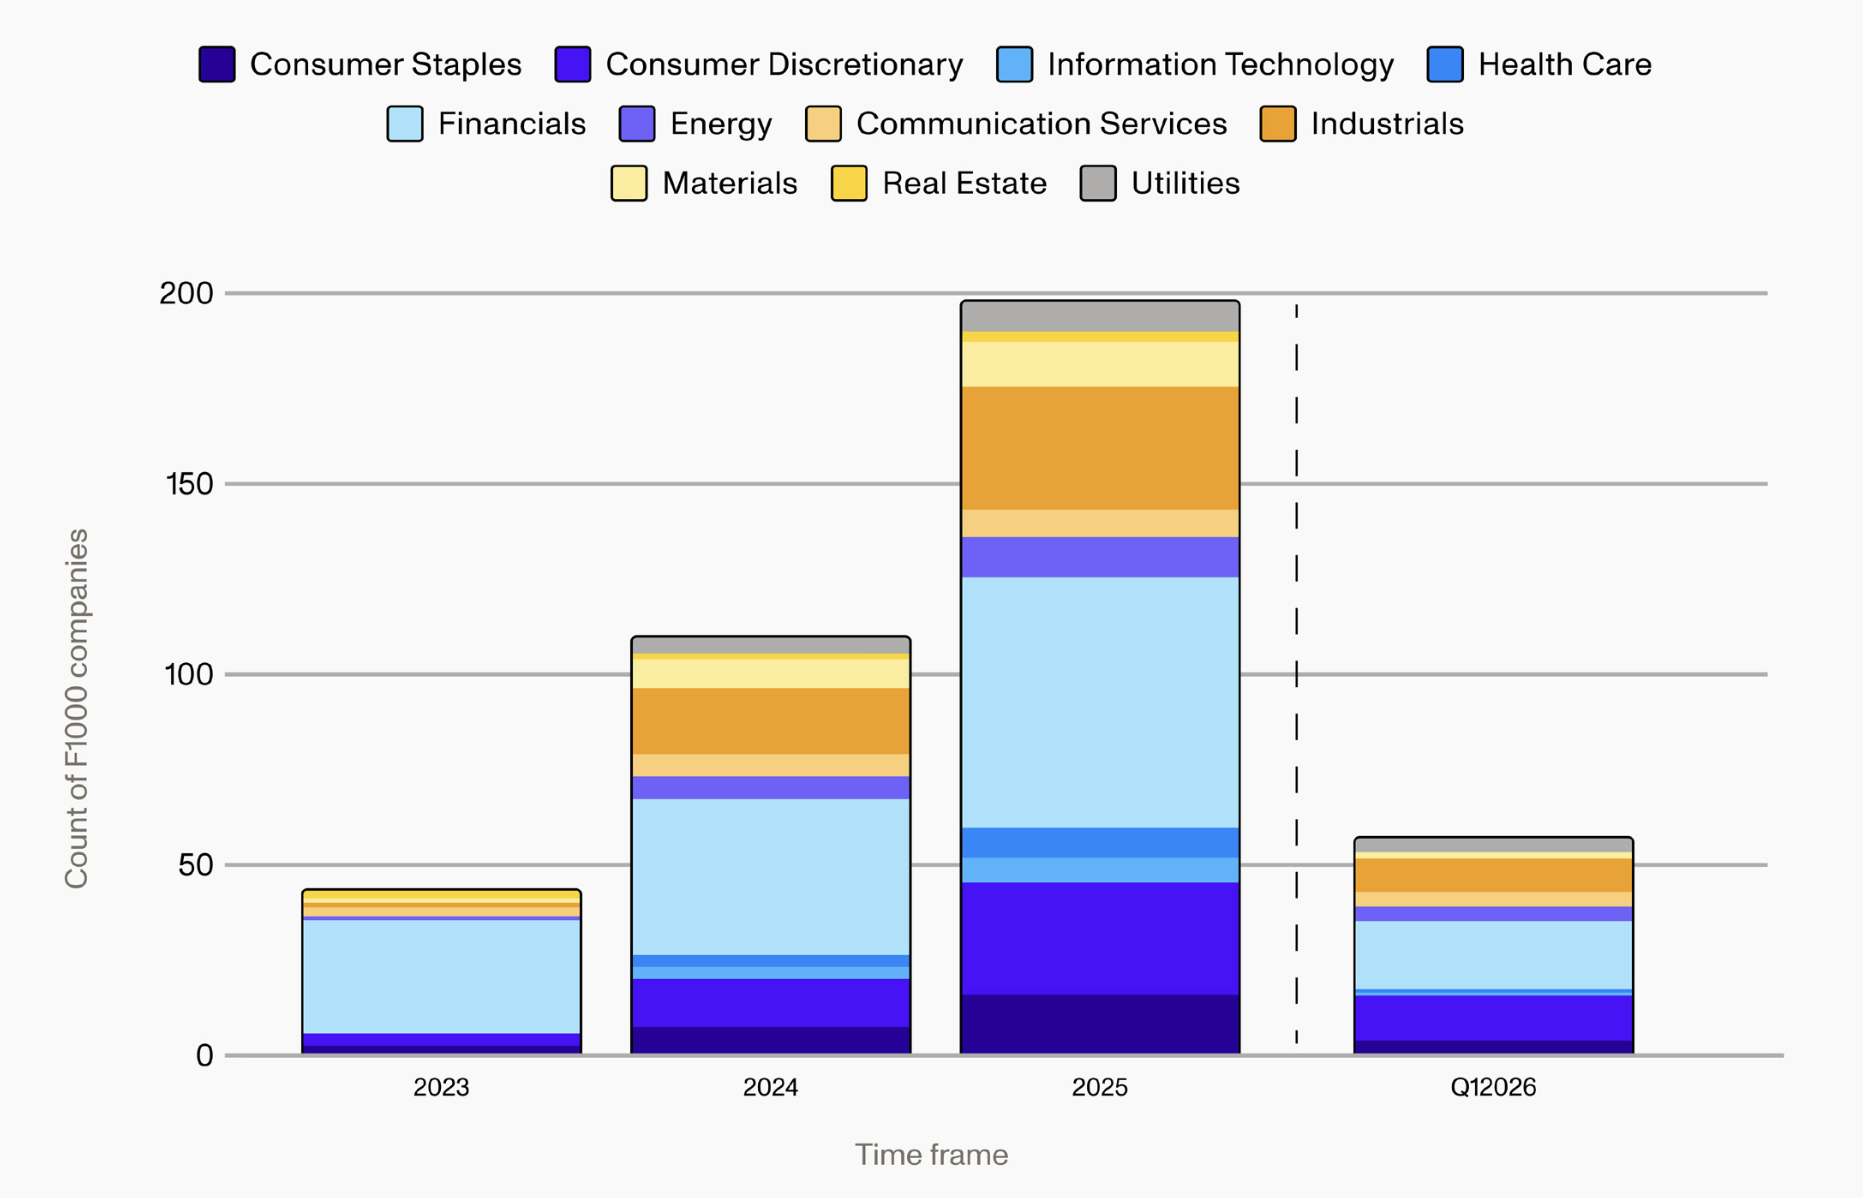
In the first three months of 2026, more than 28% of the companies that bought tax credits at any point in 2025 had already completed a new transaction. Every major industry sector is on track to meet or exceed its full-year 2025 participation rate.
If 2025 was a tale of contradictions — participation grew from 11% of potential Fortune 1000 buyers active in the tax credit market in 2025 to 21% in 2025, even as many buyers sat out to reassess their tax capacity after the passage of the One Big Beautiful Bill (OBBB) — 2026 so far shows a market in recovery.
To understand how corporate participation in the transferable tax credit market is evolving, Crux reviewed publicly available earnings reports, investor calls, and regulatory filings for publicly traded F1000 companies, supplementing with our proprietary database of active buyers.
The data shows that tax credit purchases have become a standard part of tax-management strategies — and that there’s a cost to companies that stay on the sidelines.
Download the infographic benchmarking buyer participation rates
Key takeaways
- More than 28% of the Fortune 1000 companies that bought tax credits in 2025 had already completed a new transaction by the end of Q1 2026.
- Fifty-five F1000 companies purchased tax credits in Q1 2026 alone, continuing a trend of growth from 11% of the eligible buyer pool in 2024 to 21% in 2025.
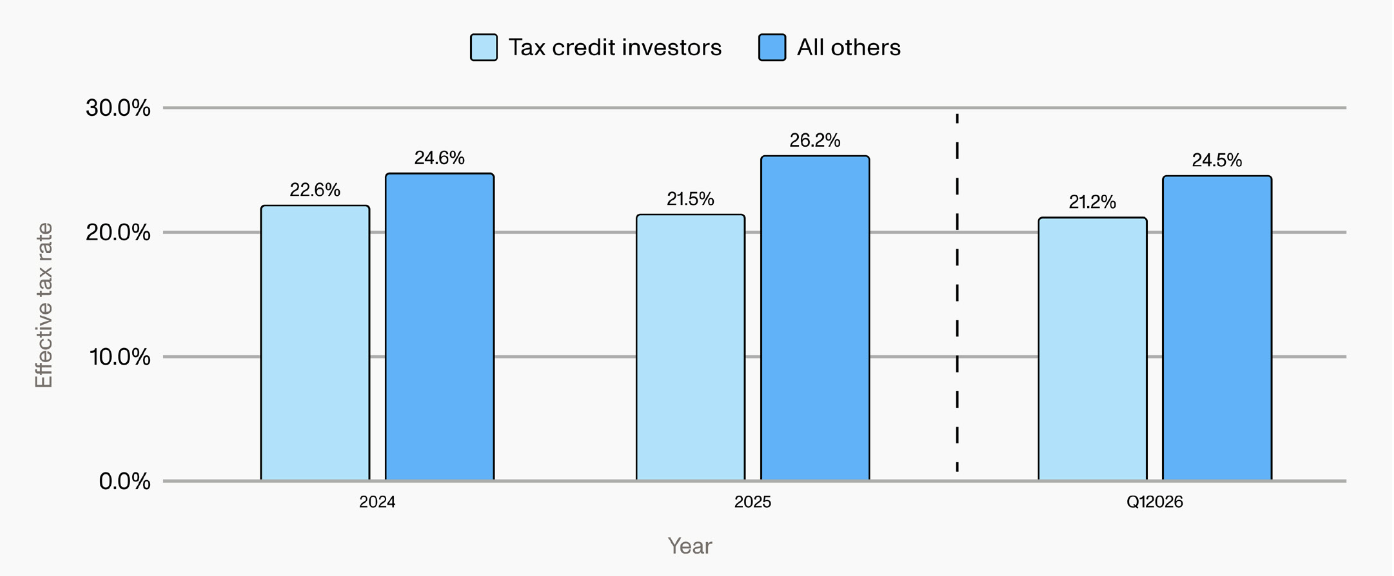
- Companies that purchased tax credits posted an average effective tax rate of 21.2% in Q1 2026, versus 24.5% for companies that did not — a gap that has held every year since 2024.
- Mid-cap companies grew to 35% of Q1 2026 tax credit investors, up from 31% in 2025, as transferability continues to lower the barrier to entry for smaller buyers.
How fast is the tax credit market recovering in 2026?
Fifty-five F1000 companies purchased tax credits in the first quarter of 2026. While this data only represents one quarter, versus a full year, it points toward acceleration — those 55 companies account for 28% of all the companies that transacted in 2025. If current momentum holds, participation will match or exceed 2025 levels.
Many buyers paused tax credit transactions in the second half of 2025 due to uncertainty over how changes in the OBBB affected their tax liabilities. With greater legislative and regulatory certainty in 2026, however, those buyers are returning to the market — and competition for high-quality tax credits is increasing ahead of the second half of the year.
F1000 companies active in the tax credit market
Who is buying tax credits?
While almost all company sizes and industry segments saw growth in tax credit market participation, that growth wasn't even across the market.
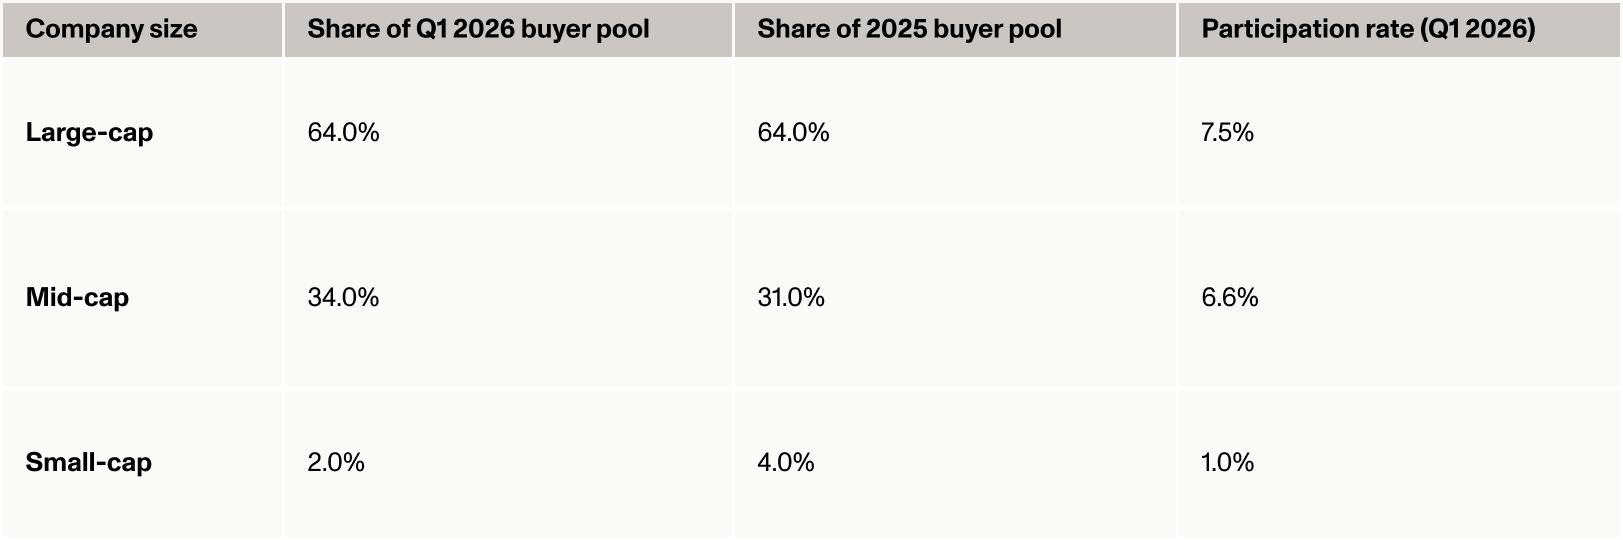
Financial services (16%) and energy (8%) led industry participation in Q1 2026. Participation among the consumer staples, consumer discretionary, and industrials segments is accelerating, however, driven by strong domestic taxable income and capital-intensive operations that reward cash preservation.
Which tax credit types are buyers prioritizing in 2026?
Production tax credits (PTCs) dominated bidding activity on Crux's platform in Q1 2026, accounting for 57.5% of bids submitted — the highest share since transferability began. Buyers favor PTCs for their simpler risk profile: no eligible basis calculation or recapture risk.
Two of the fastest-growing credit types, advanced manufacturing (§45X) and biofuels (§45Z ), are both predominantly PTC structures, reinforcing the trend.
What does sitting out of the tax credit market cost?
In Q1 2026, companies that purchased tax credits posted an average effective tax rate of 21.2%, compared to 24.5% for companies that did not — a gap of more than three percentage points. That trend holds true across the full years 2024 and 2025, as well.
There is also a compounding benefit to early and repeated participation. Companies that have established internal processes for diligence, documentation, tax opinion review, and approval workflows can transact more efficiently with each successive purchase. That accumulated institutional knowledge represents a durable advantage: lower per-transaction costs, faster execution, and greater confidence in sizing decisions as market conditions evolve.
Effective tax rates for buyers of tax credits vs. non-buyers, 1Q2026 vs. annual historicals
See where your peers stand
The full Q1 2026 Buyer Benchmarking Report — including sector-by-sector participation data, vintage and technology mix, and analysis of how Pillar Two and the corporate alternative minimum tax (CAMT) factor into purchase planning — is available exclusively to Crux clients.
To understand the key findings, download the Q1 2026 buyer benchmarking infographic.
Share