

Benchmarking F1000 participation in the transferable tax credit market (Q2 2026 update)

Share


Want to explore more conversations like this?
View all blogs
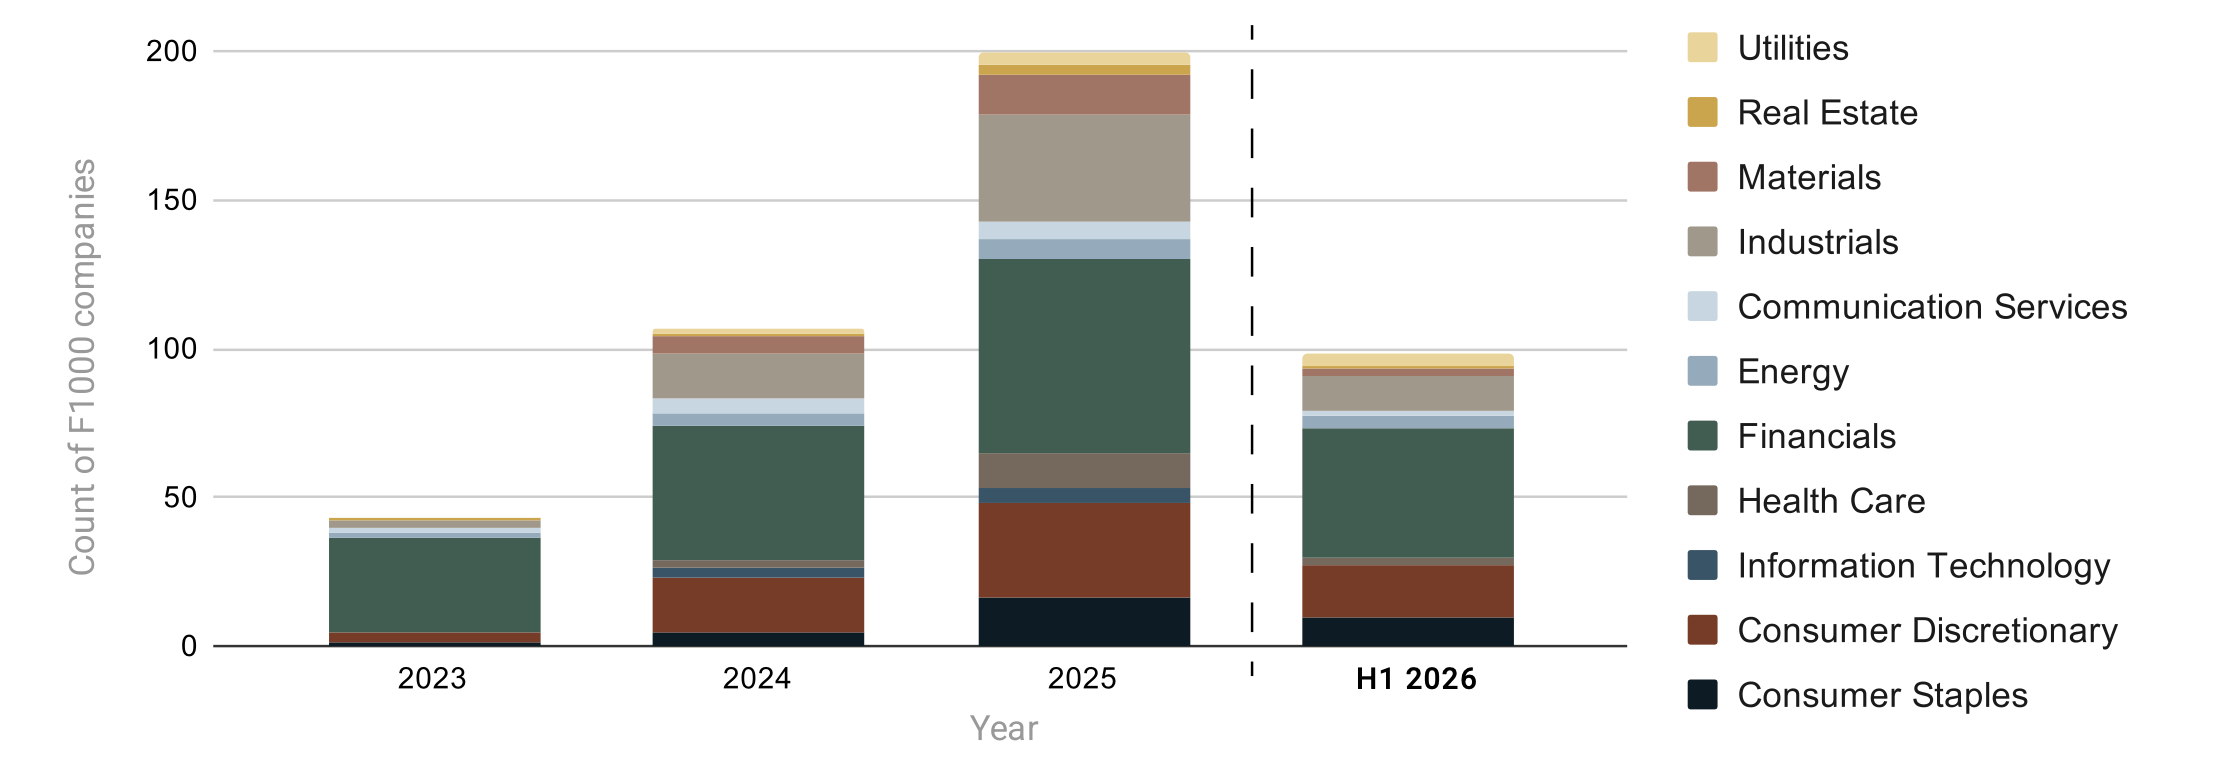
Fortune 1000 (F1000) companies kept buying tax credits through the first half of 2026, even as prohibited foreign entity (PFE) rules raised the bar for the deals they consider. Across H1 2026, 98 F1000 companies invested in clean energy tax credits, either through tax equity investments or direct transfers — on pace to match or exceed the nearly 200 companies that participated in all of 2025. The second quarter also saw the highest quarterly total transaction volume on record: $14.9 billion in transferable tax credit sales.
To benchmark corporate participation in the tax credit market, Crux reviewed earnings reports, investor calls, and regulatory filings for publicly traded F1000 companies, supplemented by our proprietary database of active buyers.
The data shows that tax credit purchases are now a standard part of corporate tax planning and that corporate tax investors are adapting their strategies to new market risks.
Download the infographic benchmarking corporate participation rates
Key takeaways
- Ninety-eight F1000 companies — about 11% of the 898 companies in the potential buyer universe — bought tax credits in H1 2026, on pace with full-year 2025 participation.
- Forty-eight companies, just under half of year-to-date buyers, purchased tax credits in both the first and second quarters of 2026.
- Crux projects total tax credit monetization will reach $70 billion in 2026, up 11% from $63 billion in 2025.
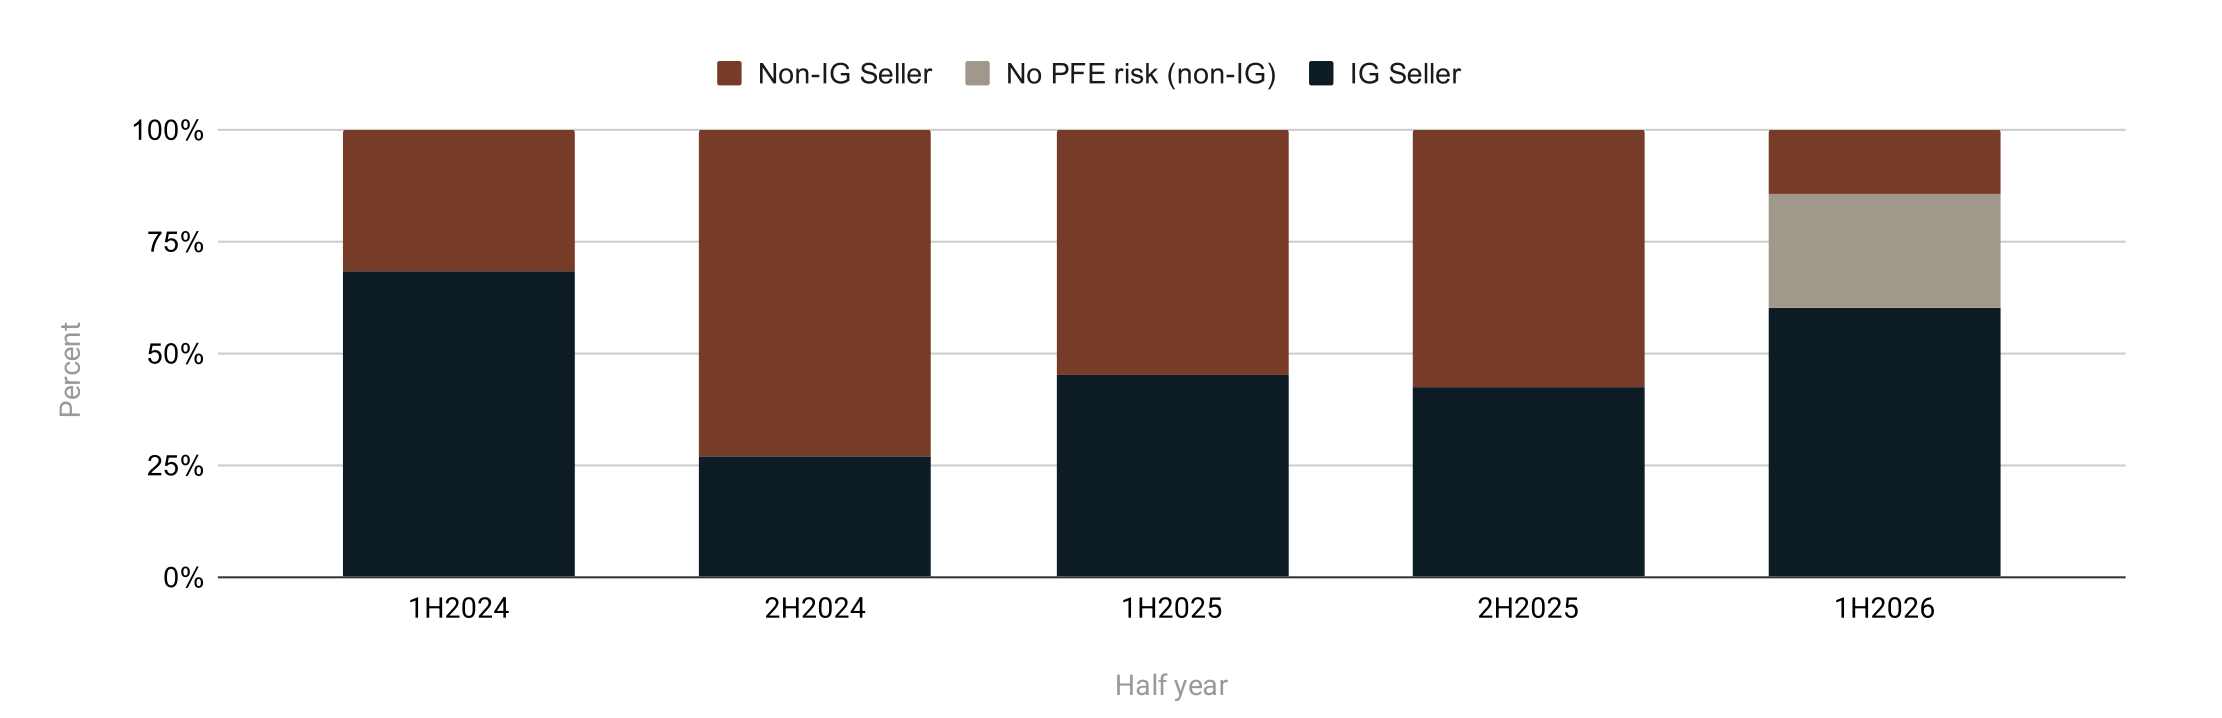
- Investment-grade sellers accounted for 60% of current-year tax credit sales in H1 2026. Tax credits exempt from PFE rules made up another 25%.
- The share of tax equity investors actively considering technology-neutral (§48E and §45Y) projects rose to 27% in mid-2026, up from 10% in 2025.
Is the tax credit market growing in 2026?
The market is growing — tax credit transfer volume reached $21 billion in H1 2026, and Q2 2026 set a quarterly record for transaction volume at $14.9 billion. Crux projects that total monetization across tax equity, preferred equity, and tax credit transfers will reach $70 billion by year-end, 11% more than in 2025.
Corporate participation is keeping pace. Year-end 10-K filings often capture purchases that quarterly 10-Qs miss, and the market tends to be busier in the second half of the year, so full-year 2026 participation will likely be more than double the H1 count.
The data also shows corporations treating tax credit purchases as an ongoing strategy. Forty-eight companies, slightly fewer than half of all year-to-date tax credit buyers, reported tax credit activity in both Q1 and Q2.
F1000 companies active in the transferable tax credit market
Who is buying tax credits?
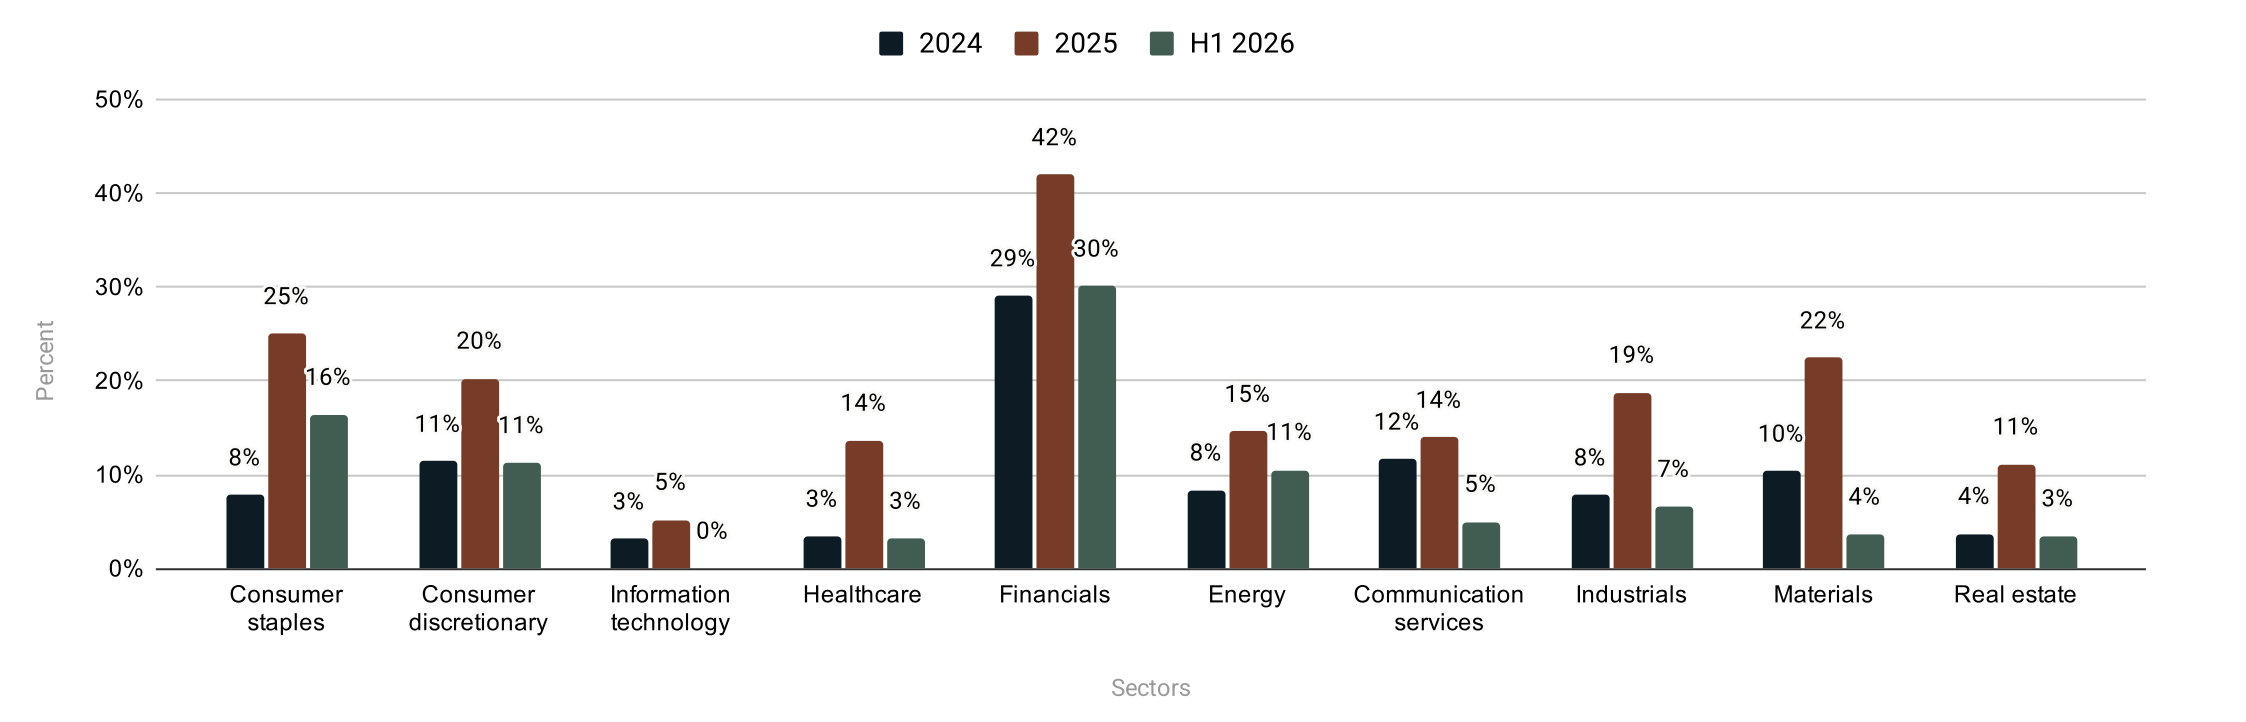
Financial institutions remain the most active market participants: 30% of F1000 financials companies purchased tax credits in H1 2026. Large, predictable domestic tax liabilities and teams accustomed to managing risk make banks and insurers well-suited to recurring tax credit purchases.
Consumer staples (16% participation) and consumer discretionary (11% participation) companies followed, supported by high, stable domestic taxable income and mature treasury functions. Energy-sector participation (11%) outpaced H1 2025 as high energy prices lifted profits, and therefore tax liabilities, for many energy companies.
Participants by sector
Looking at company size, large-cap companies participated at the highest rate (13.8% in H1 2026), followed by mid-cap (9.2%) and small-cap (4.2%) companies.
How are PFE rules shaping which tax credits buyers purchase?
Tax credit buyers are concentrating on the lowest-risk tax credits. PFE rules, which took effect on Jan. 1, 2026, restrict tax credit eligibility for projects with certain ties to prohibited foreign entities. To date, third-party tax credit insurers have been reluctant to cover PFE risk. As a result, corporate tax investors have two main ways to manage the risk: buy from investment-grade (IG) sellers whose indemnity backs the deal, or buy tax credits that are not subject to PFE rules.
Corporate tax investors pursued both strategies in H1 2026:
- IG sellers made up 60% of current-year tax credit sales, their highest share since H1 2024.
- Tax credits exempt from PFE rules — mainly legacy §45 production tax credits (PTCs) and §48 investment tax credits (ITCs) — made up another 25%.
- Only 15% of deals involved non-IG sellers of PFE-exposed tax credits, and those deals priced materially lower.
Breakdown of current-year tax credit sales from IG sellers versus non-IG sellers by sales volume
Greater certainty does come with a higher price tag. Crux has observed premiums of $0.015 for non-PFE ITCs and $0.020 for non-PFE PTCs over tax credits with PFE exposure. Because IG supply is finite and typically sells early in the year, buyers should expect a thinner, more competitive slate of premium tax credits in H2 2026.
Which tax credit types are buyers prioritizing in 2026?
Because of and in some cases despite increased compliance risk, buyers are shifting the range of tax credits they’ll purchase. Data shows that tax equity investors and tax credit buyers are growing more comfortable with technology-neutral clean electricity tax credits (§48E and §45Y), despite their PFE exposure. In mid-2026, 27% of tax equity investors said they actively consider projects eligible for §48E and §45Y, up from 10% in 2025. Most investors (66%) still describe their approach as selective, evaluating these deals case by case.
Transaction data shows a similar shift. Section 48E’s share of ITC volume ticked up from 16.8% in Q1 2026 to 18.6% in Q2, despite greater PFE exposure, as the supply of legacy §48 tax credits dwindled and buyers transacted on §48E directly.
Clean fuel production tax credits (§45Z) also saw greater market activity. H1 2026 §45Z volume reached $1.7 billion, already exceeding the $1.1 billion transacted in all of 2025. Section 45Z faces a narrower set of PFE restrictions than most tax credit types, carries no project-level material assistance requirement, and is available through 2029 under the One Big Beautiful Bill. In H1 2026, §45Z tax credits made up 6.7% of transaction volume, edging out §45X advanced manufacturing tax credits (6.5%) for the first time.
See where your peers stand
The full Q2 2026 Benchmarking Report — including market sizing by segment and tax credit vintage, volume by tax credit section, and guidance for fiscal-year tax credit buyers purchasing from calendar-year sellers — is available exclusively to Crux clients and partners.
To understand the key findings, download the Q2 2026 Benchmarking infographic →
Share