

Tax credits in the PFE era: What tax credit investors need to know in H2 2026

Share
.svg)

.svg)
.svg)
Want to explore more conversations like this?
View all blogs
The tax credit market proved resilient in the first half of 2026, despite a very noisy start to the year. A number of tax credit buyers sat on the sidelines in the first quarter as they absorbed changes to their tax liability from the One Big Beautiful Bill. The first substantive guidance on prohibited foreign entity (PFE) rules from the US Department of the Treasury made headlines in February. A major Court of Federal Claims ruling in June provided a roadmap on cost basis. On July 4, new wind and solar projects that had not begun construction became ineligible for tax credits. But none of it slowed the market down.
In The State of Clean Energy Finance: 2026 Mid-Year Market Intelligence Report, published this week, Crux found a market defined by continued growth and innovation in the face of regulatory uncertainty.
Download the report for more insights →
The market is bigger than it was a year ago
Tax credits have proven to be a maturing, durable asset class, even through periods of regulatory uncertainty. Q2 2026 posted the largest quarter of transferable tax credit sales on record ($14.9 billion). Total tax credit monetization — tax equity, preferred equity, and direct transfers combined — is on pace to approach $70 billion by year-end 2026, up 11% from $63 billion in 2025. The transferable tax credit market alone is tracking to $47.5–49.0 billion, up 13–18% from $42.0 billion in 2025. Tax equity and preferred equity investment is projected to reach $46.3 billion, up 17% year over year, with preferred equity volume more than doubling.
Forecasted tax credit monetization by segment, 2026
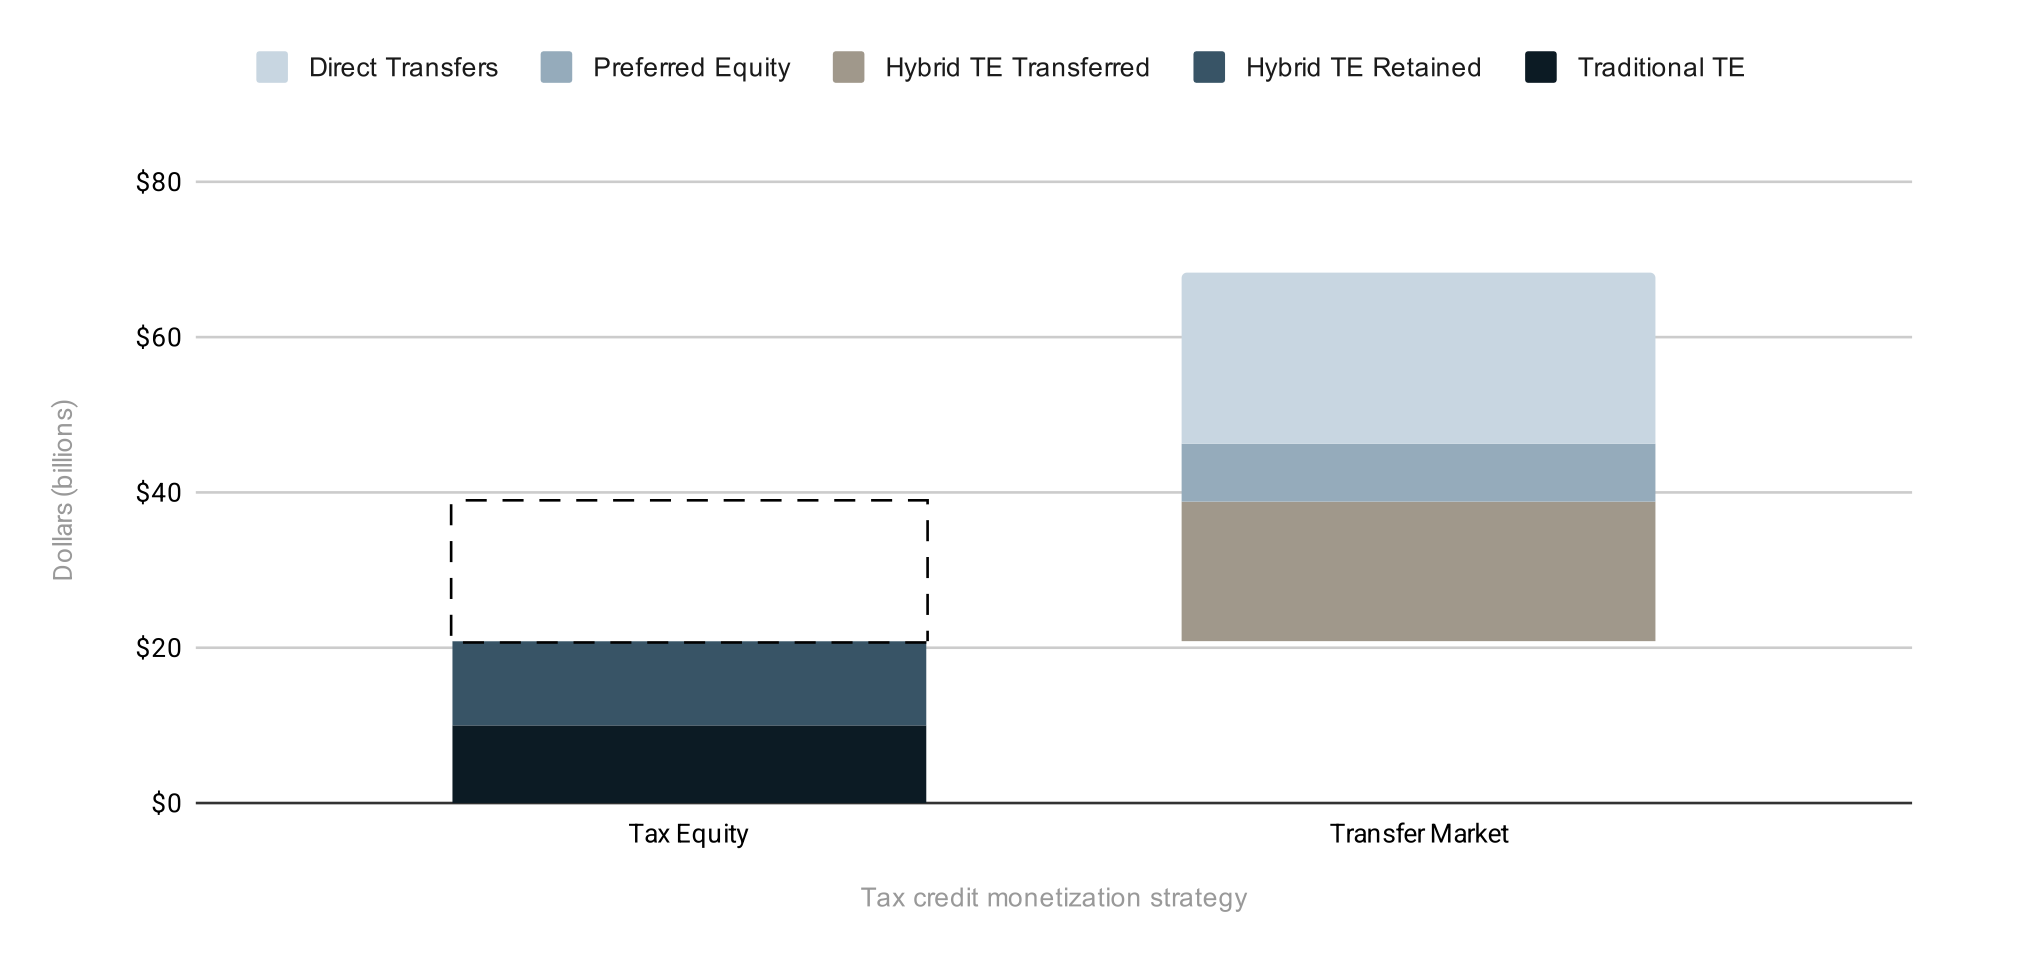
Crux expects annual tax credit supply to hold above $75 billion through 2030. Corporate tax teams who take time to build a repeatable annual program now will be positioned to scale as the market grows.
PFE risk is redirecting where buyers are looking
In February, Treasury released the first part of its guidance on PFE rules. Clean energy developers and manufacturers must comply with these rules — meant to guard against too much involvement by prohibited foreign entities in ownership and supply chains — to qualify for tax credits. Technology-neutral §48E and §45Y tax credits generated on or after January 1, 2026 are subject to these requirements.
Where possible, tax credit buyers are opting for legacy §48 and §45 tax credits, which are not subject to PFE rules. That supply is rapidly diminishing, however. Other buyers looking to minimize PFE risk are turning to new technology types.
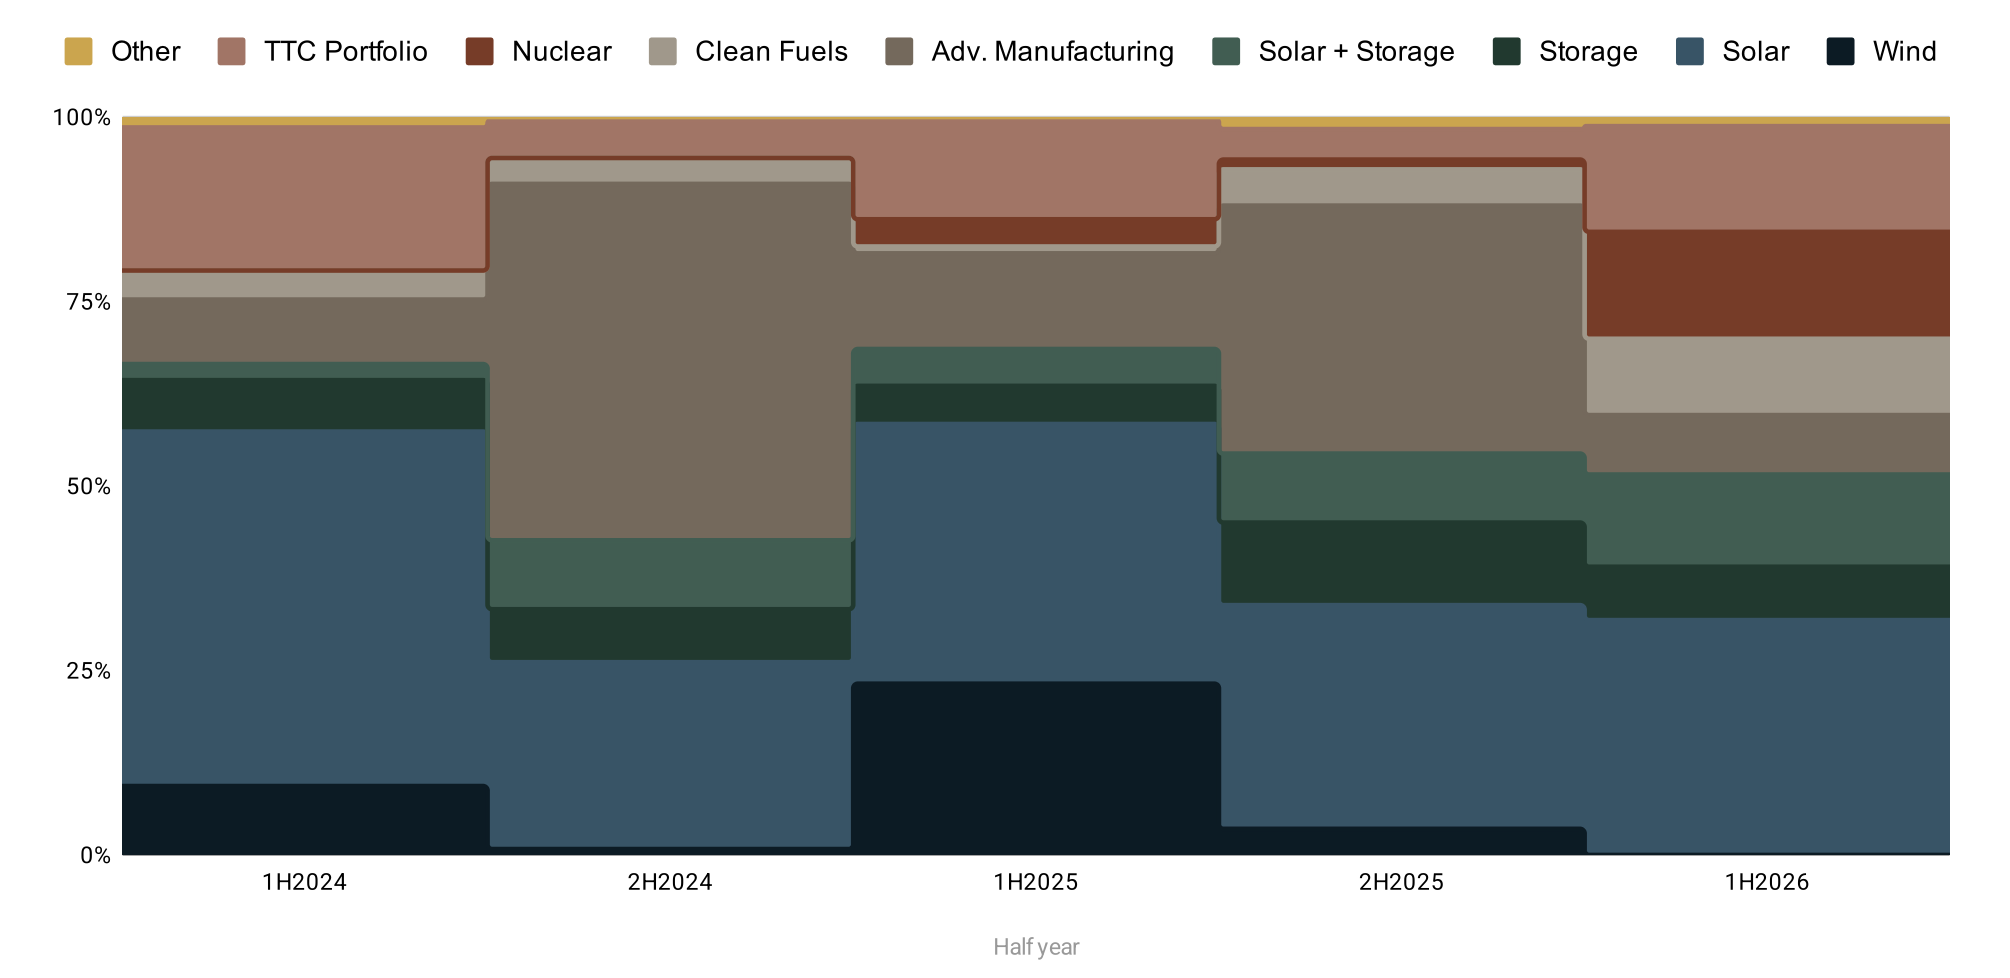
Solar and wind projects faced the heaviest PFE headwinds in the first half of the year. As a result, market share for solar declined from 35.0% in H1 2025 to 30.0% and for wind from 23.0% to 7.5%. Market share grew substantially for §45 clean fuels tax credits, which have limited PFE exposure. Crux’s data shows $1.7 billion in §45Z transactions in H1 2026, more than the $1.1 billion for all of 2025. Battery storage grew, too — to 7% of market share from 5% for standalone battery storage and to 12% from 5% for solar-plus-storage deals — tracking with record battery deployment in Q1 2026.
TTC market composition by tech type, H1 2024–H1 2026
PFE is now the dominant force driving tax credit pricing
Historically, tax credit pricing has varied based on deal size and whether the seller was investment grade (IG) or not. Those factors are still impactful, but they’re heavily attenuated by whether PFE rules apply to a tax credit deal. Crux observed premiums of $0.015 for non-PFE investment tax credits (ITCs) and $0.020 for non-PFE production tax credits (PTCs).
PFE exposure is now the single largest driver of tax credit pricing
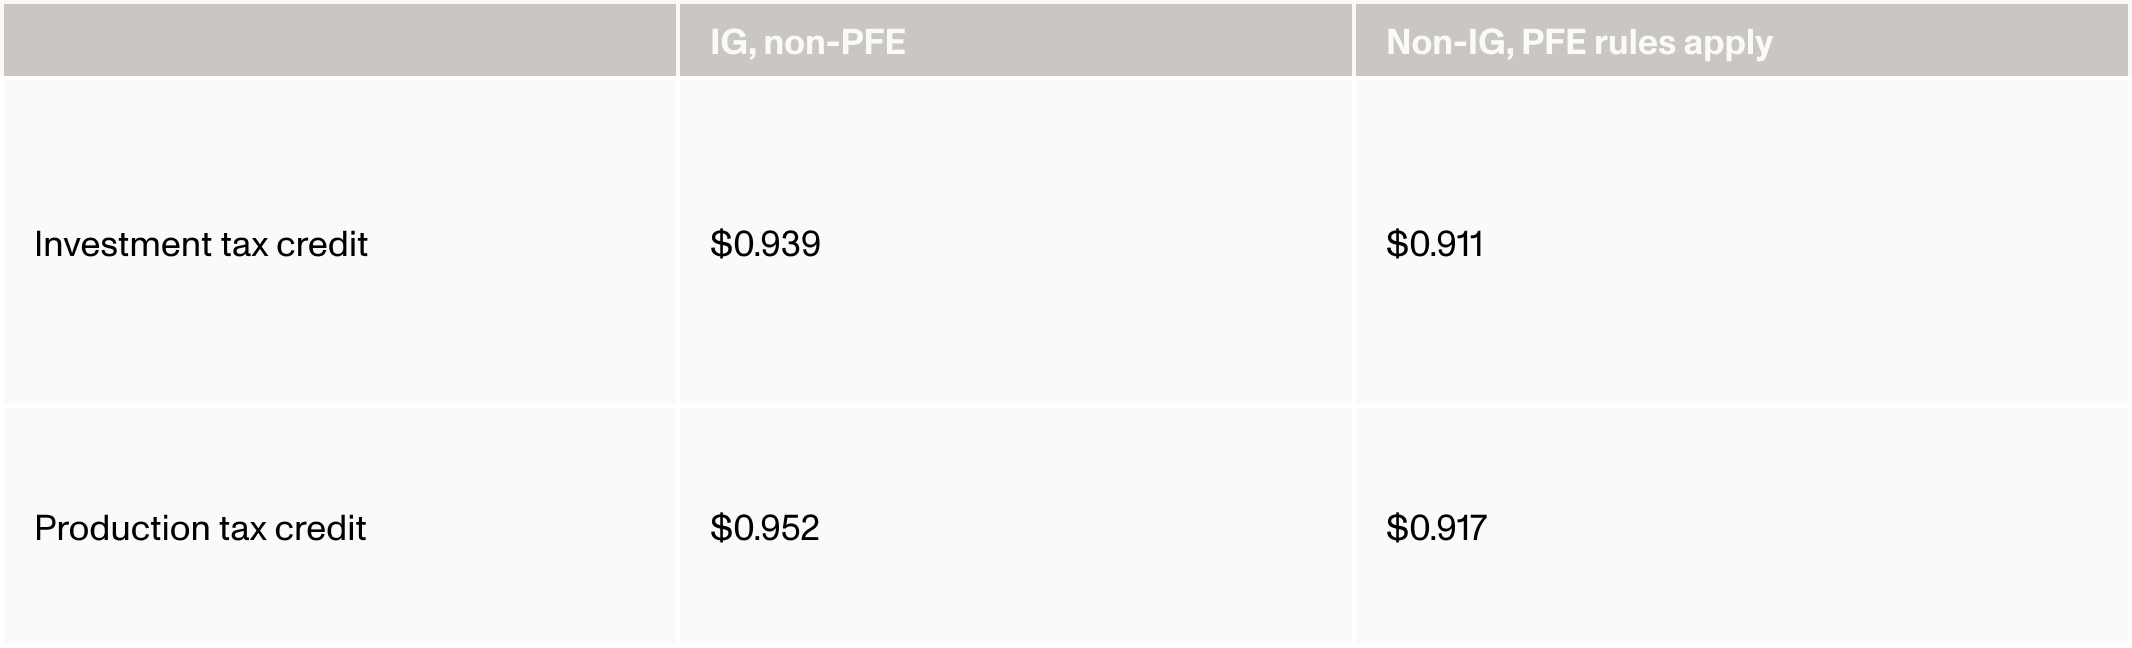
Importantly, PFE-exposed credits are still transacting: roughly $4 billion closed in H1 2026, about 20% of the market. As the pool of legacy, non-PFE credits shrinks, expect that premium to widen through H2.
The market is getting more comfortable with PFE risk
As the pricing data shows, the market is learning to price and diligence PFE exposure, even without final Treasury guidance. Where guidance remains opaque, the market has crystallized around working definitions that have allowed transactions to continue.
Law firms are issuing PFE opinions, working from a documented, risk-based process, and knowledge-qualified representations from project sponsors are becoming standard in place of flat reps. Deal terms have moved decisively in buyers' favor since 2025:
- No-fault indemnities are now standard, appearing in 94% of deals.
- Change-in-law provisions jumped from 12% of transfer agreements in H1 2024 to 55% in H1 2026.
- Among deals with a quantitative indemnity cap, 71% set it above 100% of purchase price — covering Internal Revenue Service (IRS)-assessed interest, penalties, and contest costs, not just the credit's face value.
While tax credit insurance doesn’t currently cover PFE risk, non-PFE risk is standardized and insurable. Once insurers get IRS guidance and comfort pricing PFE risk directly, coverage — and cost — will likely expand further. Crux has tailored diligence checklists, pricing benchmarks, and transaction experts to help buyers learn how to underwrite for that shift.
Looking to the rest of 2026
Annual corporate tax liability across the buyer universe runs roughly $280 billion, while the market's current absorption capacity sits closer to $45–60 billion. Corporate tax teams have real room to scale a tax credit program well beyond where most buyers are today.
The buyers who get the most out of H2 2026 will treat this as a repeatable annual program and position for where supply is headed: storage, manufacturing, and next-generation tech-neutral categories. That takes real diligence infrastructure.
Crux provides tax credit buyers with the infrastructure and data to run a program at scale, from credit sourcing to pricing to diligence on PFE risks and credit quality — all with one expert team. All of our transactions are built on the same $85 billion dataset that informs our market intelligence reports. Crux clients have access to our full resource library, pricing benchmarks, and exclusive policy briefings.
To learn more about the H1 2026 market — including key trends and policy context — download the mid-year market intelligence report.
Share