


Transferable tax credit pricing guide for 2026


Prohibited foreign entity (PFE) exposure became the leading driver of transferable tax credit pricing in the first half of 2026, overtaking deal size and seller credit quality. Buyers paid more for tax credits exempt from PFE rules and required larger discounts for those subject to them.
In the first quarter of 2026, tax credit sales slowed as buyers and sellers worked through new PFE rules. Activity picked up quickly in the second quarter, with $14.9 billion in tax credit sales, the highest quarterly total on record. Crux estimates third-quarter volume reached $11 billion to $15 billion, potentially another record quarter despite ongoing PFE uncertainty.
This guide draws on Crux’s 2026 Mid-Year Market Intelligence Report and Crux’s latest quarterly pricing data, built on a transaction dataset of nearly $90 billion. It explains how PFE exposure, seller credit quality, insurance, and deal structure affect pricing.
Download the full 2026 Mid-Year Market Intelligence Report for the complete dataset behind these findings.
Key takeaways
- In the first half of the year, 2026-vintage investment tax credits (ITCs) averaged $0.913 per $1 of tax credit value and production tax credits (PTCs) averaged $0.930, below historical norms.
- Tax credits exempt from PFE rules sold at premiums of about $0.015 for ITCs and $0.020 for PTCs. About 80% of first-half transfer volume had no PFE exposure, and Crux expects tax credits subject to PFE rules to grow to 25% of volume in the second half.
- The premium for investment-grade (IG) sellers narrowed to about $0.015 from $0.030 in 2025. Tax credits sold by non-IG sellers without PFE exposure generally priced above those sold by IG sellers with PFE exposure.
- Crux expects the price gap between legacy and tech-neutral tax credits to widen until Treasury issues PFE guidance, which could help narrow it.

Get our latest insights and favorite reads on the transferable tax credit market in your inbox.
What are transferable tax credits selling for in 2026?
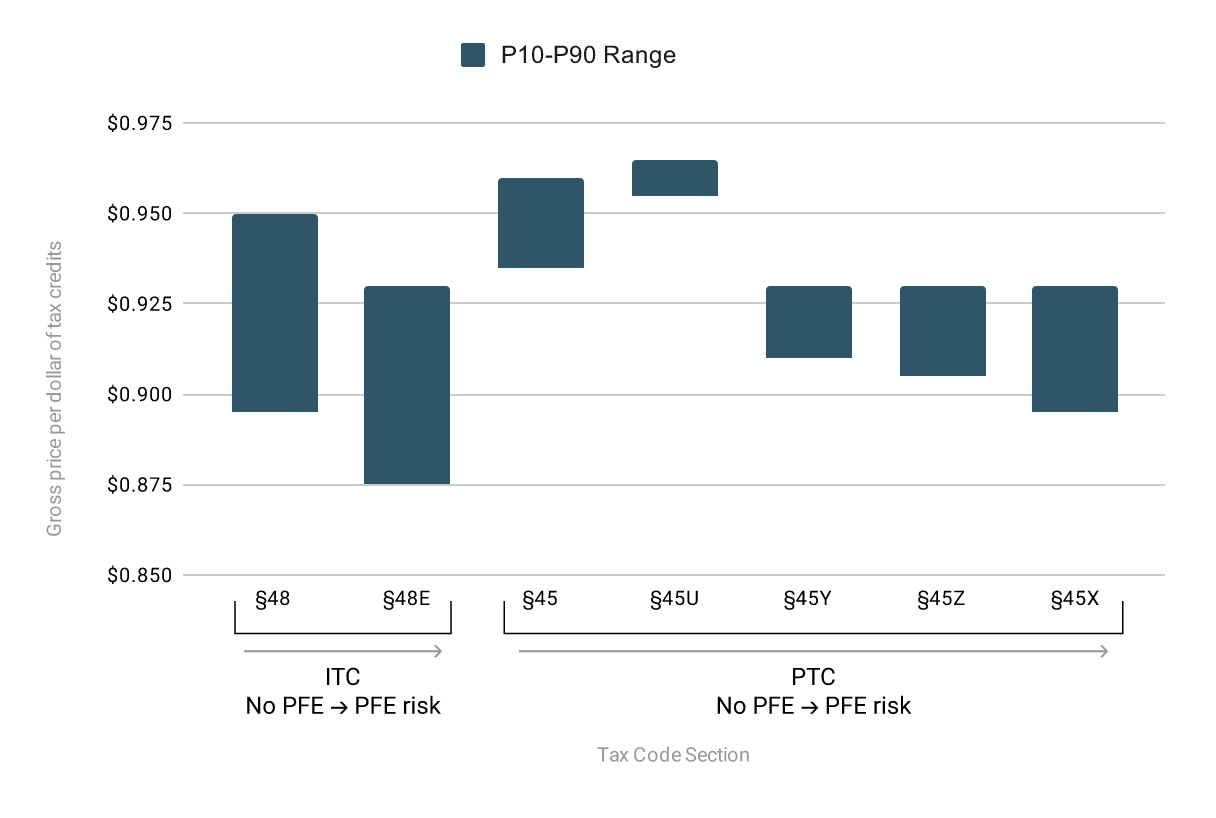
In the first half of the year, 2026-vintage ITCs averaged $0.913, while PTCs averaged $0.930. Both were below historical norms of $0.920–$0.925 for ITCs and $0.940–$0.950 for PTCs.
Tax credits without PFE exposure continued to command premium pricing. IG sellers of these non-PFE-exposed tax credits averaged $0.939 for ITCs and $0.952 for PTCs. Legacy §45 tax credits, which are exempt from PFE rules, were one of the only categories that priced in line with past years, typically transacting at $0.940–$0.960 depending on deal size and sponsor quality.
Third-quarter data shows the same pattern. 2026-vintage utility-scale ITCs averaged $0.927, with 92% of volume in legacy §48 tax credits. 2026-vintage utility-scale PTCs averaged $0.949, almost entirely legacy §45 tax credits from IG sellers.
Across tax code sections, tax credits subject to PFE rules generally priced below those exempt from them, with a few notable exceptions covered below.
Range of prices for tax credits in H1 2026 by tax code section (P10–P90)
What drives tax credit pricing in 2026?
PFE exposure comes first
Tax credits subject to PFE rules sold at a discount of about $0.015 for ITCs and $0.020 for PTCs, compared with tax credits exempt from them. The discount is larger for PTCs because buyers have historically viewed PTCs as lower risk: they carry no recapture risk, and they avoid the IRS scrutiny of basis step-ups that ITCs face. PFE exposure erodes much of that advantage.
Much of the PFE discount comes down to who is buying. Most buyers prefer tax credits exempt from PFE rules, and they are competing for a shrinking supply. Buyers willing to take on PFE exposure require more diligence and stronger contractual protections, and they factor that work into what they will pay.
Which PFE rules apply depends on the tax code section and, for §48E and §45Y, when construction began.
PFE exposure and seller credit quality together determine where a tax credit lands:
A few tax credit types stand out:
Section 45U: The nuclear production tax credit priced at the top of the market despite its PFE exposure. It is subject only to the ownership test until 2028, and most §45U sellers are publicly traded IG companies whose ownership is relatively straightforward to diligence.
Section 45Z: The clean fuel production tax credit faces the same ownership-only test until 2028. Crux estimates that 2026-vintage §45Z tax credits are largely sold out. Roughly $500 million may remain, mostly from renewable natural gas facilities that already sold tax credits and now qualify for more after the US Department of Energy’s September update to its emissions model.
Section 45X: Advanced manufacturing tax credits are subject to every PFE rule. Pricing for 2026-vintage §45X tax credits held at $0.901 in the third quarter, compared with $0.925–$0.930 from the third quarter of 2025 through the first quarter of 2026. Advanced manufacturing deals made up about 33% of third-quarter transaction volume, well below their typical share of roughly 50%, as some sellers without near-term cash needs may be holding their tax credits in hopes that Treasury guidance will improve pricing or other terms.
Multi-credit portfolios: Some sellers are getting stronger pricing on tax credits with PFE exposure by selling them in multi-credit portfolios. These transactions package tax credits from several tax code sections, often combining tax credits that have PFE exposure with legacy or clean fuel tax credits that have less or no PFE exposure. Buyers get diversified exposure, and the portfolio prices at the top of the market. The approach works best for large, creditworthy sellers with enough projects across tax code sections to build a portfolio.
For the latest on PFE rules, see Crux's PFE resource hub.
Legacy vs. tech-neutral tax credits: How pricing differs
Section 48E trades about $0.015 below §48 across deal sizes, and it made up only about 20% of ITC volume in the first half of 2026. Section 48E tax credits are still transacting, but slowly. Crux believes many sellers, especially larger developers, are waiting for Treasury guidance and expecting better insurance options and commercial terms once it arrives. Until then, Crux expects the gap to widen as legacy supply shrinks.
For sellers of tech-neutral tax credits, that means preparing a diligence package that answers buyers’ PFE questions now, so it is ready when guidance arrives.
Seller credit quality and indemnity
Seller credit quality still matters, but it carries less weight than it did in prior years. The premium for IG sellers narrowed to about $0.015 in the first half of 2026, from $0.030 in 2025, as PFE exposure became the bigger factor.
Pricing still tracks the seller’s creditworthiness and the strength of the indemnity it can offer. That matters most for tax credits subject to PFE rules, where an IG seller can stand behind the tax credit directly if it is lost.
Across the market, buyers are also asking for more protection overall. In 71% of transfer agreements with a quantitative indemnity cap, the cap was set above 100% of the purchase price, covering IRS interest, penalties, and contest costs.
Technology, deal size, and timing
Community solar, commercial and industrial (C&I) solar, and residential solar tax credits generally price lower because they carry more diligence and administrative work relative to the volume of tax credits they generate. In the third quarter, 2026-vintage distributed generation (DG) ITCs averaged $0.900, compared with $0.927 for 2026-vintage utility-scale ITCs. DG deals also include more tech-neutral tax credits: legacy §48 made up 51% of 2026-vintage DG ITC volume in the third quarter, compared with 92% for utility-scale.
Historically, larger deals command higher pricing than smaller deals. Deal size continued to affect pricing in 2026 but to a lesser degree than in past years. Larger deals tend to transact first, and smaller deals often transact the year after the tax credit is generated.
Timing also reflected the market’s adjustment to the One Big Beautiful Bill (OBBB). After the law passed in mid-2025, many large buyers stepped back to reassess their tax liabilities, then returned in early 2026 to cover their 2025 obligations. That pushed prior-year tax credits to 32% of first-half volume, up from 23% a year earlier. Some buyers with predictable tax liabilities are already looking to 2027. Legacy §48 tax credits for 2027 have started to transact at prices similar to 2026-vintage tax credits, in the low $0.90s.
How much do insurance and PFE rules affect price?
Tax credit insurance protects a buyer if the IRS later reduces, disallows, or recaptures a transferred tax credit. Policies reimburse the buyer for the lost tax credit value and, in many cases, associated interest and penalties.
Buyers generally expect one of two protections: an indemnity from an IG seller, or insurance. Insurance works as a substitute for seller credit quality, so it matters most for non-IG sellers and can raise the gross price their tax credits command. Among non-IG sellers of §45X tax credits, insured deals transacted at an average of $0.908 in the third quarter, compared with $0.884 for uninsured deals. Non-IG sellers with insurance also accounted for about 87% of §48E volume in the first half of 2026.
Insurance typically does not cover PFE risk. Insurers are waiting on Treasury guidance, expected by the end of 2026, before they can fully price it. Until then, an indemnity from an IG seller is the most widely accepted protection for PFE risk. Some transfer agreements now commit the parties to discuss adding PFE coverage once insurers offer it, and buyers are asking for that provision up front.
What insurance costs
Insurance costs rose across the market in the first half of 2026, and a growing share of policies priced at 5.0% or higher. For power projects, policies averaged 3.4% of total deal cost, within a 2.0%–5.0% range. When comparing offers, sellers should look at net proceeds as well as gross price. Sellers usually pay for the policy and underwriting fees, either directly or through a lower tax credit price. For smaller projects, a portfolio policy that covers several projects can make insurance more cost-effective.
How transfers fit with tax equity and preferred equity
Tax credit transfers can stand alone or form part of a broader financing structure. Traditional tax equity investors retain the tax credits, while hybrid tax equity and preferred equity structures often incorporate a transfer. Each structure tends to serve different investors and projects, and each targets a different return.
Traditional tax equity is priced lowest because a single investor takes both the capital position and the tax credits directly. That investor also takes a significant ownership stake in the project partnership, so it must clear PFE ownership and effective control tests itself, which has made many tax equity investors cautious about tech-neutral projects. More than half of survey respondents had not pursued tax equity for tech-neutral projects at all, and among those who did, only 7.3% had successfully raised it.
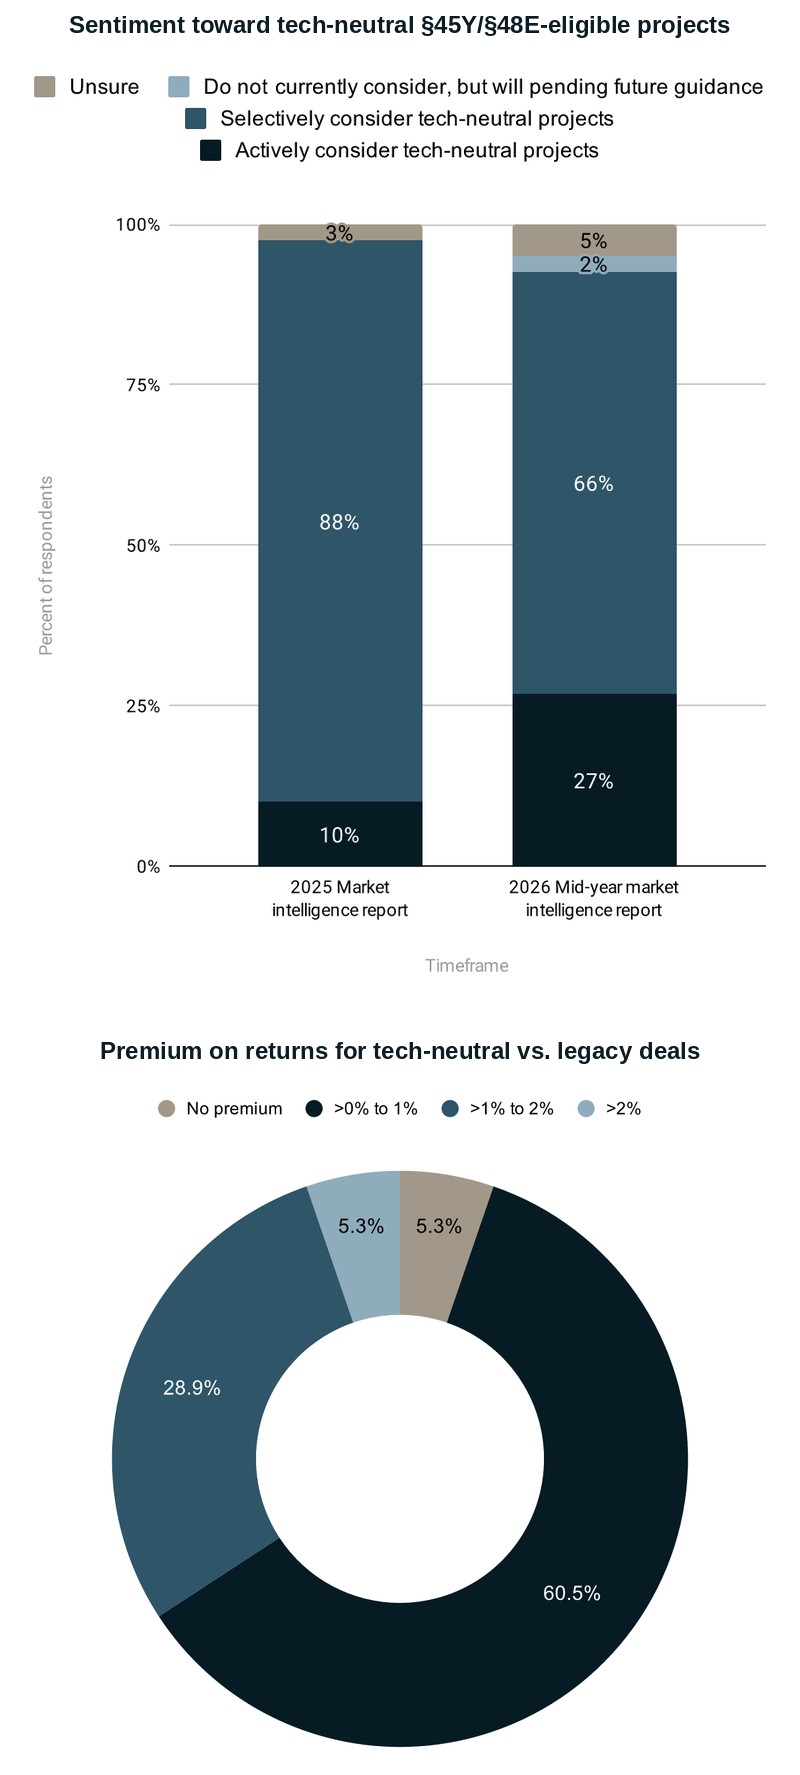
Investor willingness to evaluate tech-neutral projects increased in the first half of 2026. Active consideration of §45Y and §48E projects rose to 27% from 10% in 2025, although roughly 70% of investors remained selective. No surveyed investors said they would rule out tech-neutral tax credits regardless of future guidance. Most targeted a 0%–2% premium on returns for tech-neutral deals over legacy deals.
How to protect your price before year-end
- Strengthen your diligence package.
Document ownership, relevant contracts, and applicable supply chain diligence. A clear, well-supported PFE analysis can improve buyer confidence and support stronger pricing. - Decide how you will support your tax credits.
Both a creditworthy parent guaranty and insurance can support higher gross pricing, but confirm which risks each covers. If you need insurance, start early. - Weigh payment timing against price.
Buyers that pay later usually offer a higher gross price, while earlier payment typically comes with a lower gross price.
Crux expects the tax credit transfer market to grow 13%–18% in 2026, to $47.5 billion–$49.0 billion. When Treasury releases guidance on PFE ownership and effective control, Crux will share what it means for tax credit pricing on its PFE resource hub.
Crux works across tax credit transfers, tax equity, preferred equity, and debt, and helps sellers price PFE exposure and credit quality into their transactions. To talk through how these pricing dynamics apply to your tax credits, contact Crux.
Download The State of Clean Energy Finance: 2026 Mid-Year Market Intelligence Report.