
The state of clean energy finance in H1 2026: Key market takeaways

Share
.svg)

.svg)
.svg)
Want to explore more conversations like this?
View all blogs
In our market intelligence report looking back at 2025, Crux posited that activity in the 2026 clean energy project finance market would hinge on how effectively market participants could adapt to meet new realities — from increasingly selective capital provider preferences to new transaction structures to shifting market and policy conditions.
Six months into 2026, the market has grown across every headline capital metric.
Data from the first half of the year shows a market that is innovating and maturing across the capital stack. New structures and technologies have surged in popularity, supporting real but uneven growth as the market adapts to a new rulebook.
Download the report for more on H1 2026 market performance →
The market backdrop set up a momentous 2026
Investment in clean and critical infrastructure is fueling energy supply and domestic manufacturing amid historic electricity demand growth, a supply side that can’t keep pace, and federal policy changes. Those pressures were sharpened by the Iran conflict raising oil prices, record data center spending, and ever-more acute affordability concerns.
On the policy side, tax credit eligibility for new wind and solar projects expired on July 4, 2026, and the market spent H1 absorbing the One Big Beautiful Bill (OBBB) and its prohibited foreign entity (PFE/FEOC) rules. The US Department of the Treasury and the Internal Revenue Service (IRS) issued only partial guidance on PFE rules, leaving the market’s biggest open question unresolved.
Key takeaways from H1 2026
PFE risk is the dominant force shaping the tax credit market
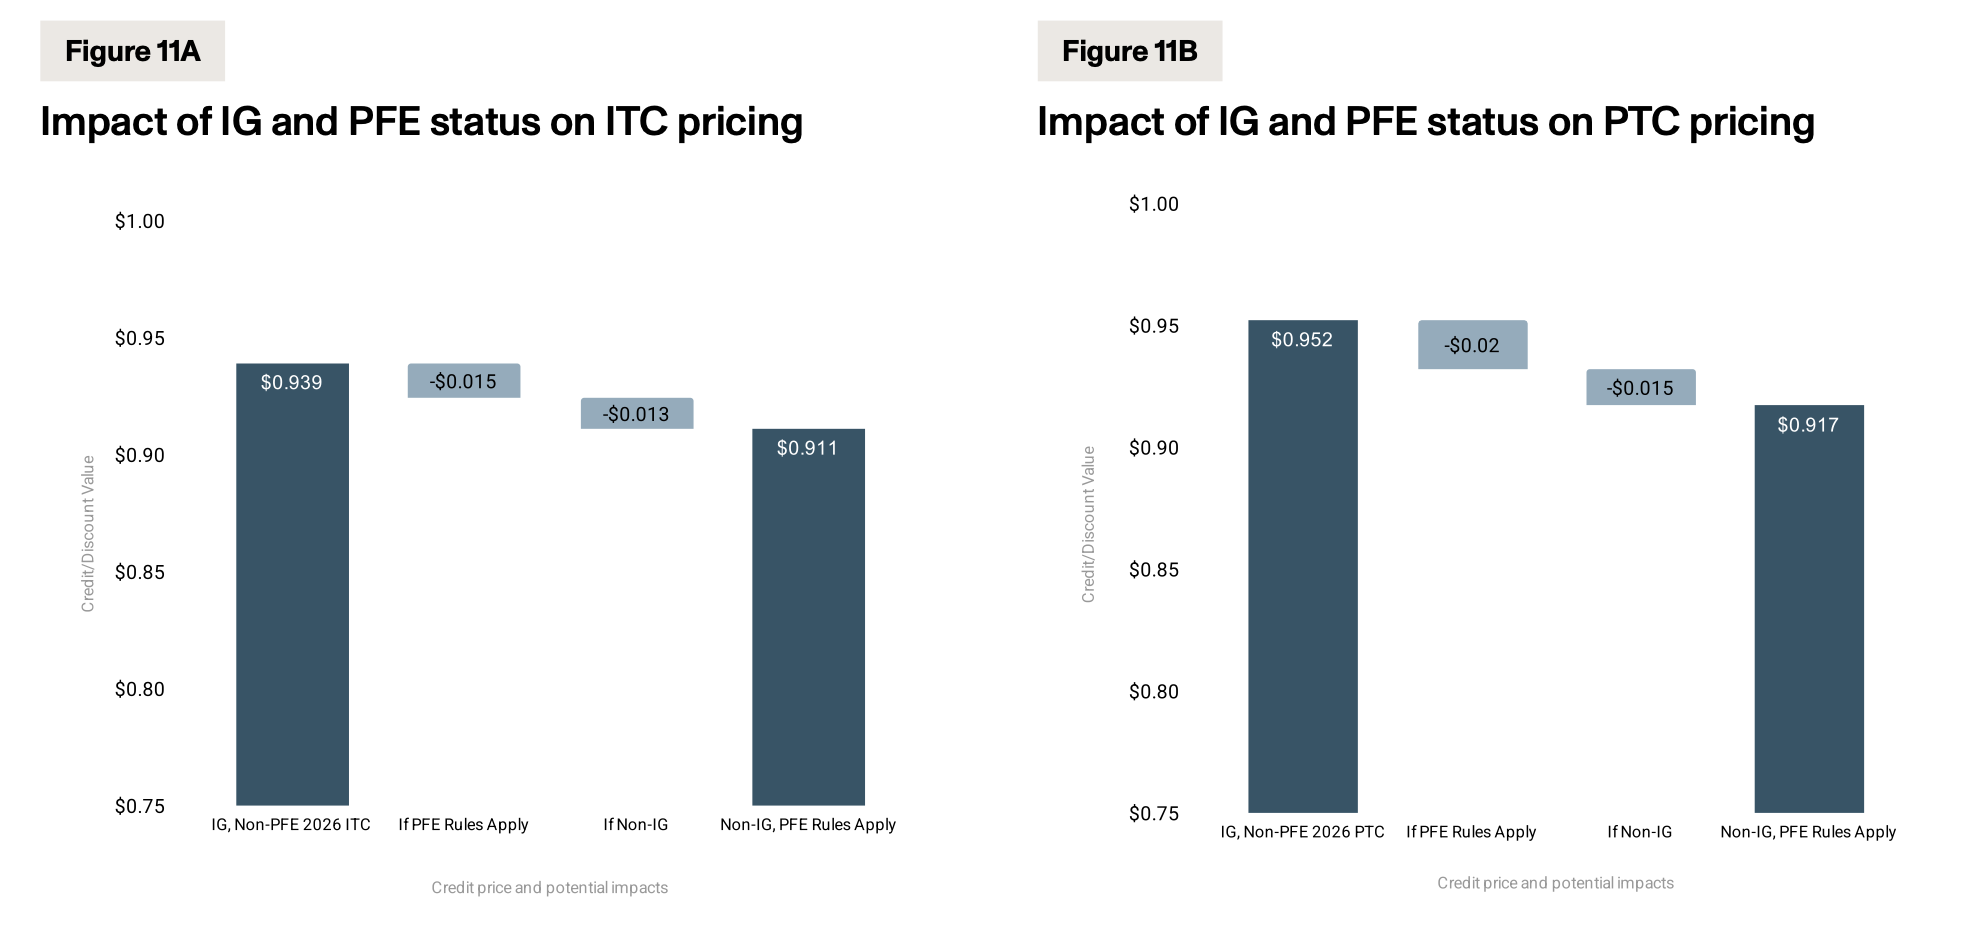
Historically, deal size and tax credit seller rating have driven tax credit pricing — in 2025, investment-grade sellers commanded a price premium of $0.03. In H1 2026, whether or not a tax credit was subject to PFE rules explained more of the pricing variance than deal size or seller rating.
- Investment tax credits (ITCs): Prices for ITCs subject to PFE rules declined steeply, selling for roughly $0.015 below tax credits exempt from the rules. This held true across every tranche and seller-rating.
- Production tax credits (PTCs): The discount for PTCs subject to PFE rules is roughly $0.02, larger than the ITC discount. That’s likely because PTCs are generally viewed as lower risk, so PFE exposure erodes that benefit.
Impact of IG and PFE status on tax credit pricing
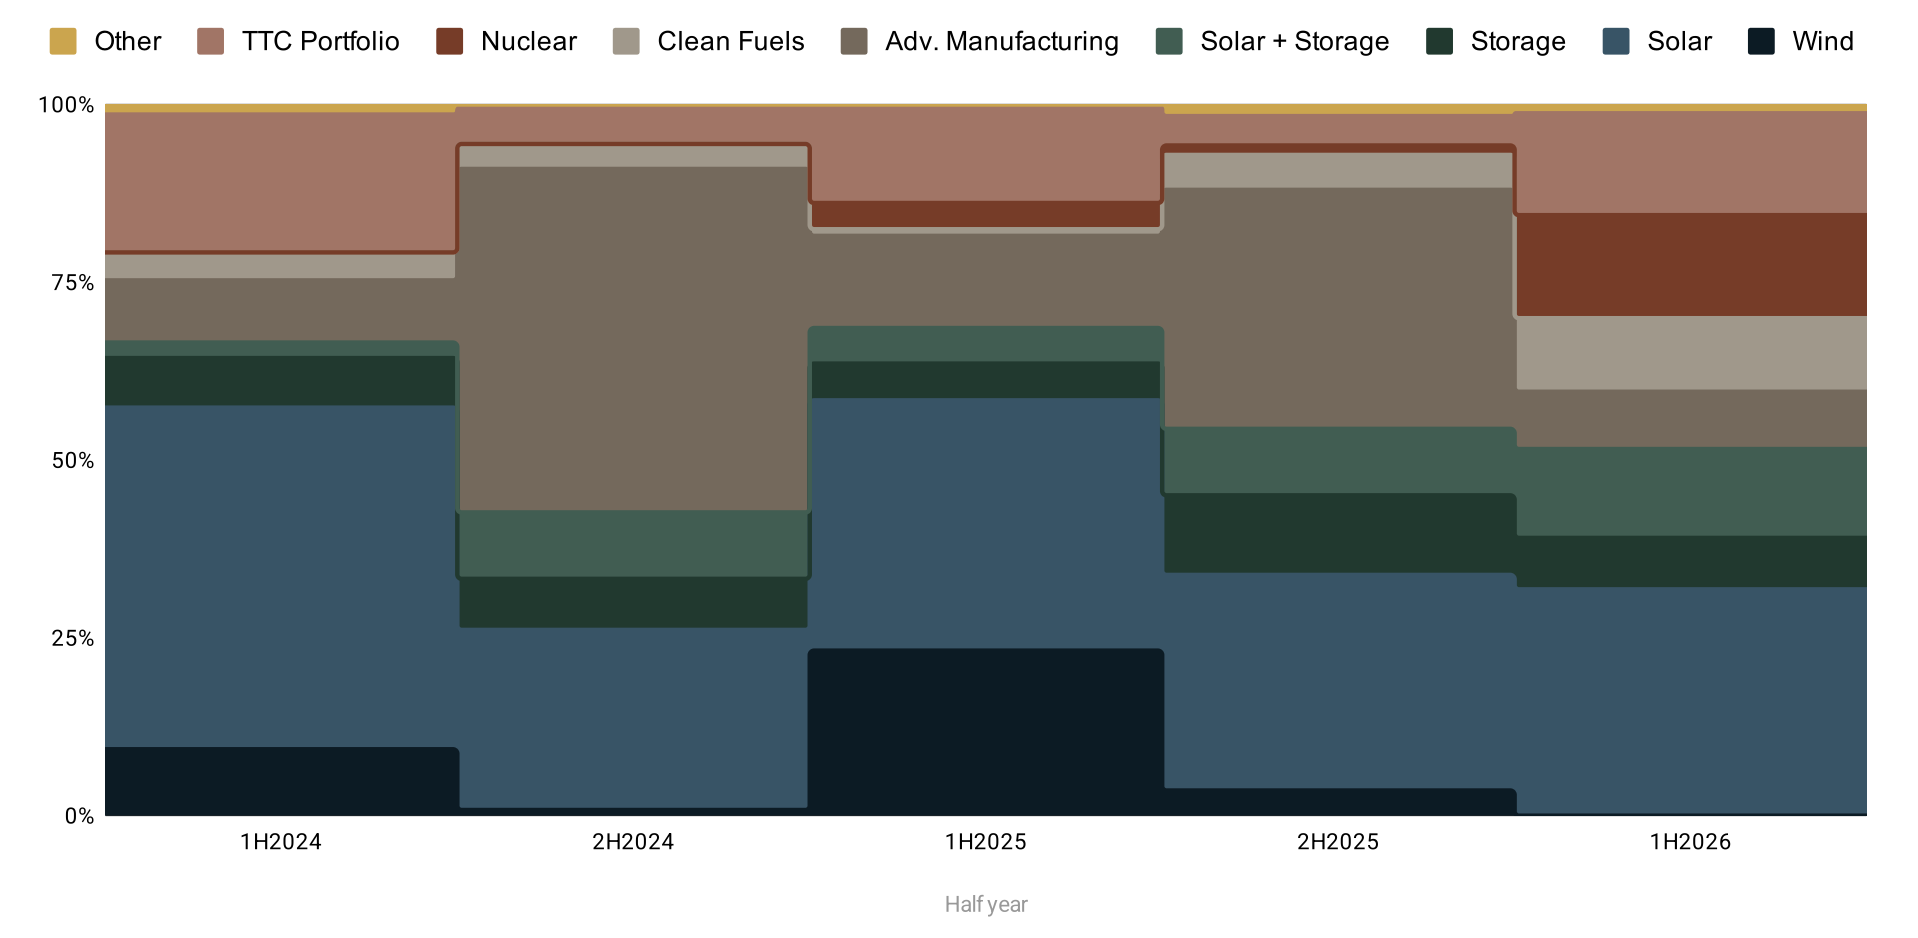
As the market worked to understand and price PFE risk, tax credit buyers flocked to tax credits with the least PFE exposure. Section 45U PTCs for existing nuclear facilities and multi-credit portfolios priced at the very top of the H1 2026 market, well above the market-wide averages for 2026 ITCs ($0.913) and PTCs ($0.930).
The technology mix in the tax credit market shifted, too. Market shares for solar and wind, which face the heaviest PFE and permitting headwinds, fell from 2025 levels — from 35.0% to 30.0% for solar and from 23.0% to 7.5% for wind. Battery storage and §45Z clean fuels PTCs grew to fill in the gaps.
TTC market composition by tech type, H1 2024–H1 2026
Hybrid and preferred equity structures are driving total tax credit monetization to ~$70 billion in 2026
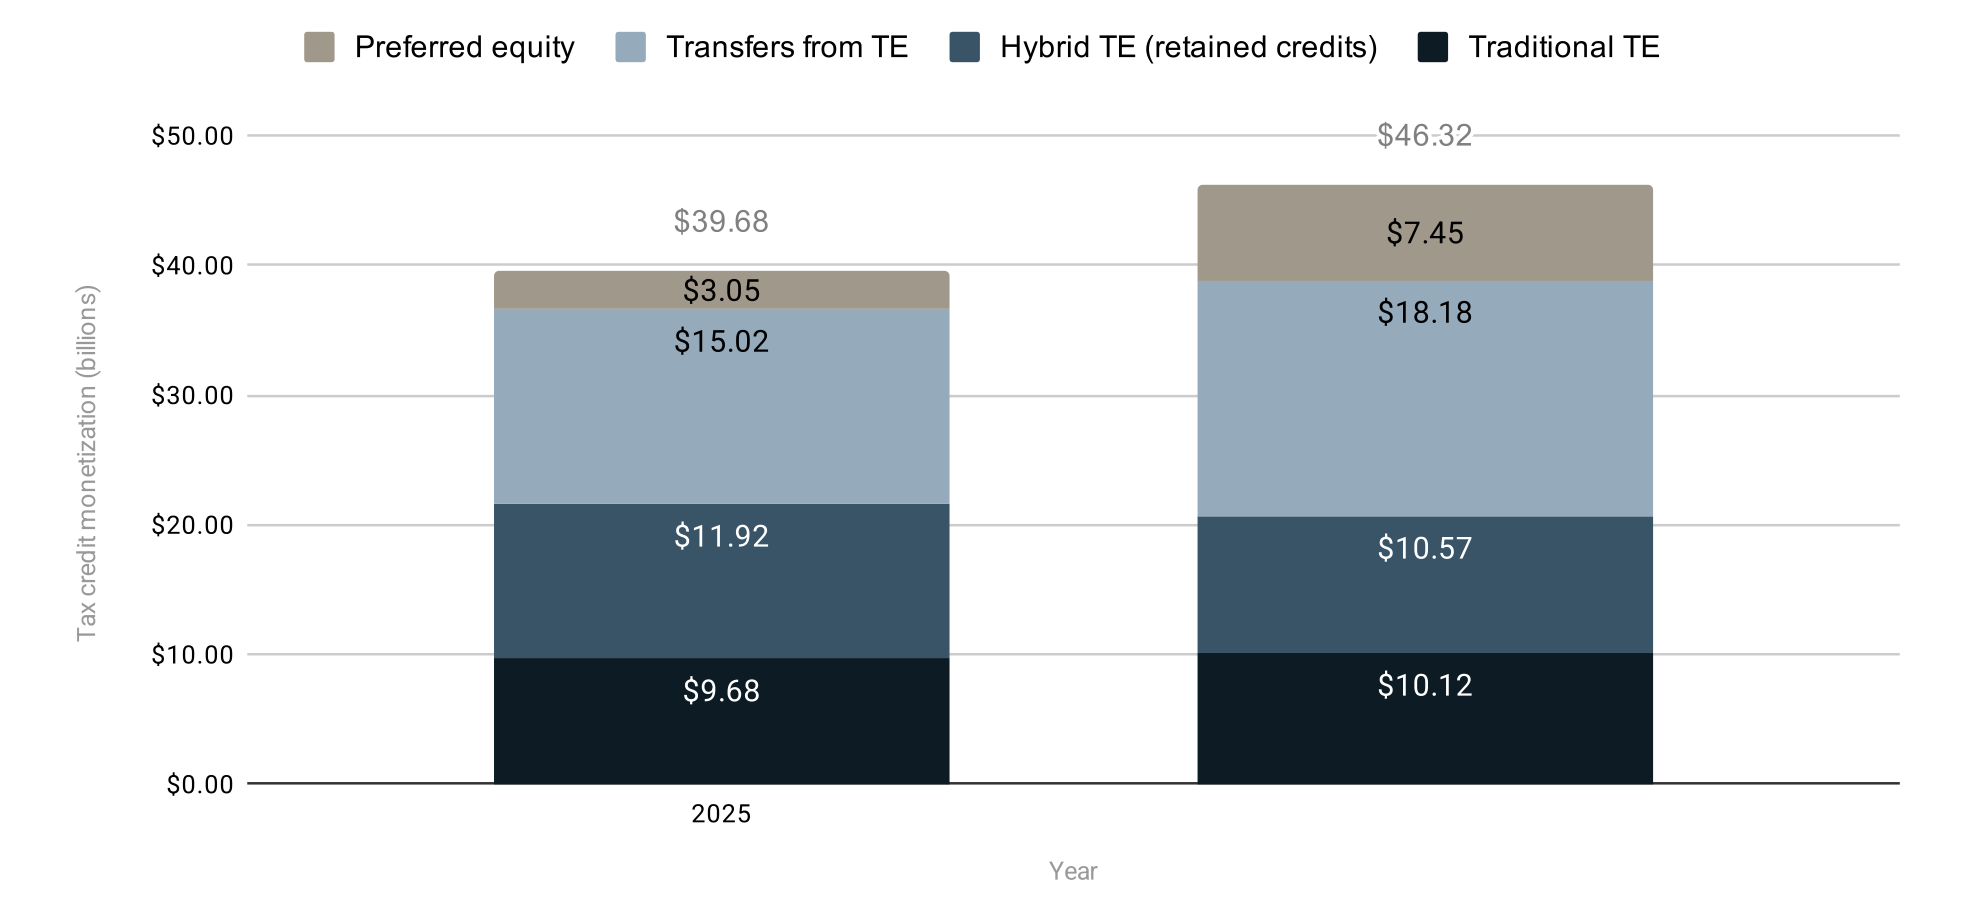
Total tax credit monetization (transferable tax credits and tax equity) is on pace to approach $70 billion in 2026, up from $63 billion in 2025. Crux expects growth in tax equity and preferred equity investment to reach $46.3 billion, up 17% from 2025 levels. That’s largely due to growth in two areas:
- Hybrid tax equity structures, which bring together a sponsor (the project developer or owner) and a tax equity investor in a partnership that allows for the sale of clean energy tax credits to a third party. Hybrid structures dominated deal volume at $28.8 billion in H1 2026.
- Preferred equity, which gives investors priority rights to cash distributions and asset liquidation over common stakeholders. Pref equity investors have higher risk appetites and do not take a large ownership stake in projects, so they’re not as exposed to PFE risk as traditional tax equity investors are. Preferred equity is projected to more than double to $7.45 billion in 2026.
Tax credit monetization by segment, by year, 2025–2026
That growth does hinge on continued engagement with PFE-exposed deal types: credits with PFE risk are expected to grow to at least 25% of the market in H2 2026. Tax investor sentiment toward §45Y/§48E technology-neutral tax credits is starting to shift as market participants get more comfortable pricing and diligencing PFE risk, even without full Treasury guidance.
Total lending to the clean energy sector rebounded from late 2025
Crux estimates greenfield debt financing across power, manufacturing, and clean fuels grew 12% to $59 billion in H1 2026. That’s up from $53 billion in H2 2025, though still below the H1 2025 high. Lending to the power segment alone was $51 billion, driven by data center and manufacturing demand.
Total greenfield debt financing by segment, H1 2025–H2 2026
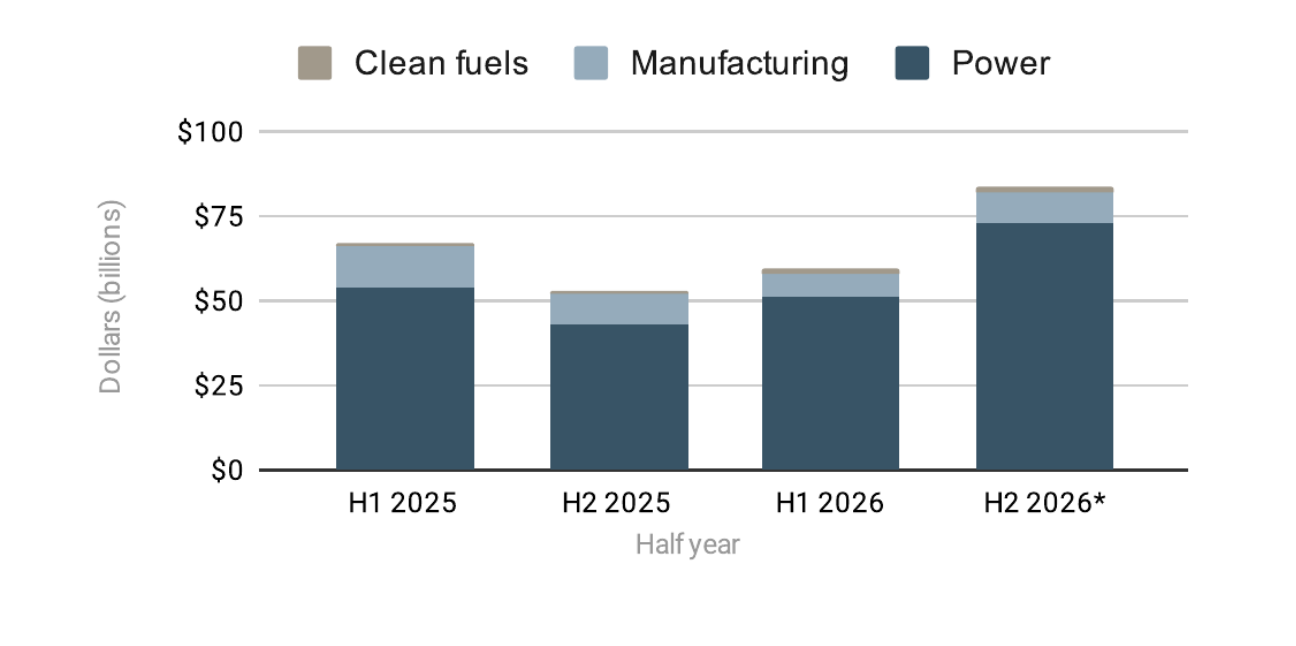
Construction lending remained the largest category in the debt stack at an estimated $41 billion, while tax credit and tax equity bridge loans grew to $12 billion. Bridge lending was the fastest-growing debt category in the period.
Crux estimates full-year 2026 lending will exceed $142 billion, a 19% increase over 2025.
What comes next?
For the full year, Crux forecasts:
- Transferable tax credit volume: $47.5–49.0 billion (up 13–18%)
- Total tax credit monetization: approaching $70 billion (up 11%)
- Total clean energy lending: exceeding $142 billion (up 19%)
- Full-year capex: $180 billion
Whether the pricing discounts seen in H1 2026 unwind in the second half depends largely on the pace and substance of Treasury's forthcoming PFE guidance. The market participants poised for success are the ones who get comfortable pricing new risks now, rather than waiting for perfect clarity.
The State of Clean Energy Finance: 2026 Mid-Year Market Intelligence Report, published today, goes deeper into the full market picture. Based on Crux’s proprietary $85 billion dataset, the report examines how new market realities impact clean energy financing across debt capital markets, tax equity and preferred equity, and the transferable tax credit market.
Share