
Tracing clean energy supply chains: Where America builds and where it buys
Share
.svg)

.svg)
.svg)
Want to explore more conversations like this?
View all blogs
In a new Crux survey of 75 organizations that develop, manufacture, or supply US clean energy projects, 81% of buyers said supply chain constraints delayed a project, manufacturing ramp, or procurement decision in the past year. More often than not, the delays also added production costs.
The cause traces back to where domestic manufacturing has taken hold. US manufacturers have largely built the end of the clean energy production line, but solar wafers and cells, electrode active materials used in batteries, and refined critical minerals are still largely imported. That leaves developers and manufacturers exposed to foreign sourcing and the regulations that come with it, and they are absorbing the cost.
Our new whitepaper, The State of the Clean Economy Supply Chain: Where America Builds, Where It Can’t, and What Can Be Done About It, combines survey results with US customs data and interviews with manufacturers, trade associations, and industry coalitions to evaluate supply chain gaps — where they lie, how deep they run, and whether they are closing. This article summarizes the key findings.
Download the full whitepaper for more detailed insights →
§45X has sparked a domestic manufacturing buildout
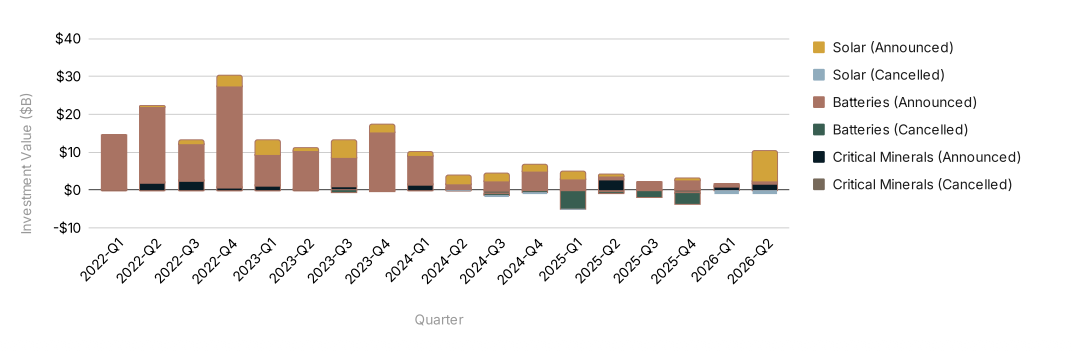
The §45X advanced manufacturing production tax credit, created under the Inflation Reduction Act (IRA) in 2022, pays manufacturers to make clean energy components in the US. Since it took effect, analysis by Rhodium Group & the Massachusetts Institute of Technology Center for Energy and Environmental Policy Research found that realized manufacturing investment across solar, batteries, and critical minerals has grown roughly tenfold, from $3.3 billion in 2020 to $33.3 billion in 2025. Between Q1 2022 and Q2 2026, those three sectors saw about $185.0 billion in announced investments against roughly $17.5 billion in cancellations.
That investment has sparked material gains in capacity. US solar module manufacturing capacity has grown roughly eightfold since §45X took effect, reaching about 75.3 GWdc (per the Solar Energy Industries Association), enough to cover domestic module demand. Domestic lithium iron phosphate (LFP) battery module and storage system capacity, at roughly 75 GWh per year, is also sufficient to meet demand, according to the American Clean Power Association. For the first time in about a decade, every stage of the solar supply chain, from polysilicon through modules, has some domestic production.
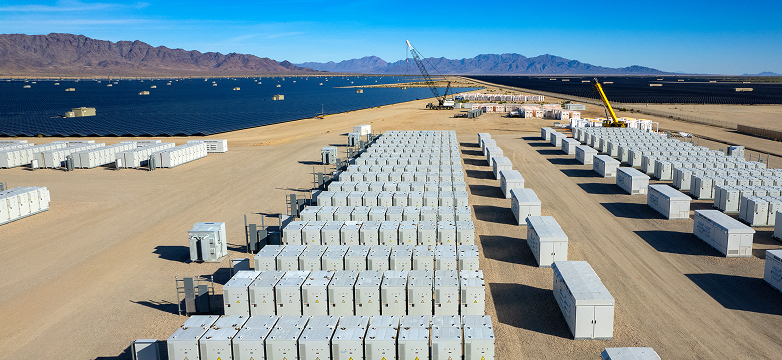
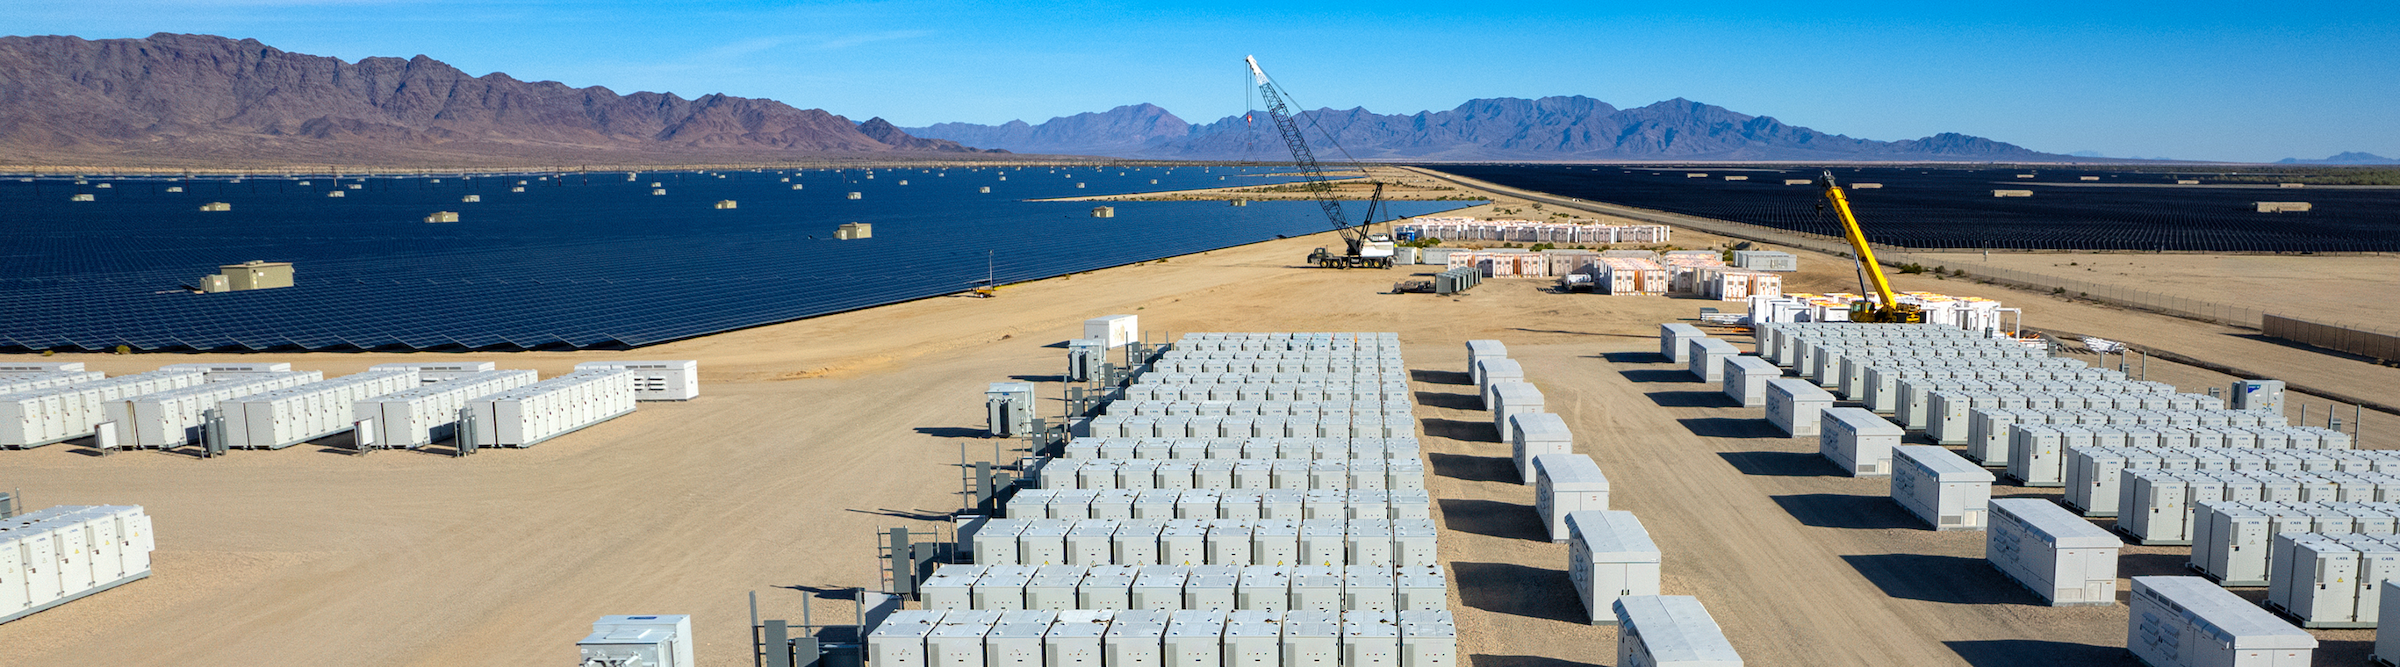
But where that capacity sits matters. The US has built the end of the production line first — modules and battery packs have scaled, while many of the components that go into them are still largely imported.
Investment announcements and cancellations by technology and quarter, Q1 2022–Q2 2026
US sourcing is shifting to other countries faster than it’s coming home
The whitepaper examines four categories: solar, battery energy storage systems (BESS), grid equipment, and critical minerals. In some, US imports are shifting away from China. Across all four, sourcing is moving to other countries much faster than it is moving to the US.
The survey backs this up: as Section 301 and Section 232 tariffs have expanded, 47% of respondents primarily shifted toward non-Chinese, non-US suppliers, compared with 32% who shifted toward US-based supply. The top barrier respondents cite is capacity. Forty-seven percent say no domestic producer exists at sufficient scale for their most constrained inputs.
Solar
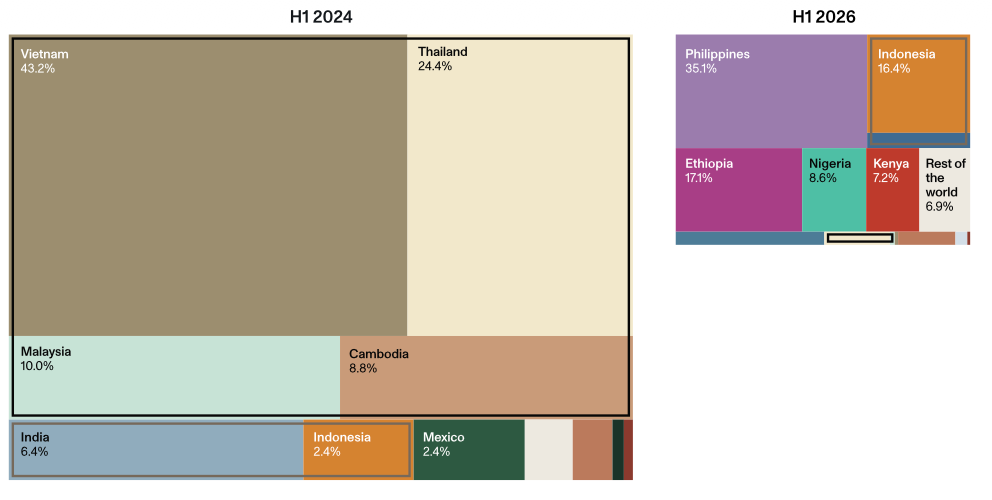
Trade enforcement has redrawn the map for modules. Four Southeast Asian countries covered by antidumping and countervailing duty (AD/CVD) orders supplied 86% of crystalline silicon (c-Si) module import value in H1 2024 and less than 2% in H1 2026. The Philippines, Ethiopia, Nigeria, Kenya, and Djibouti, which recorded effectively no shipments of c-Si modules two years earlier, together supplied 71% in H1 2026.
Meanwhile, cell imports rose 50%, and China controls roughly 95% of global wafer capacity, according to the International Energy Agency (IEA). Solar's import exposure moved one step upstream.
US c-Si module imports by country, H1 2024 and H1 2026
BESS
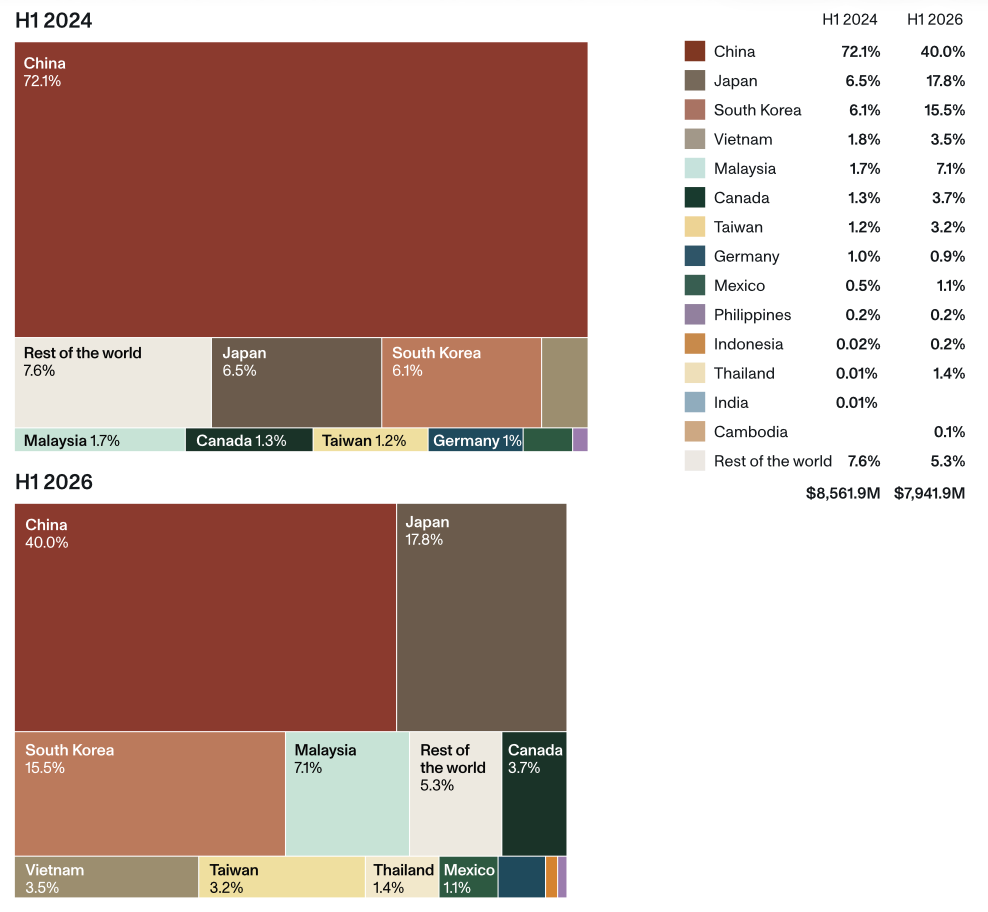
China's share of lithium-ion battery import value fell from 72% in H1 2024 to 40% in H1 2026, while Japan, South Korea, and Malaysia rose from a combined 14% to 40% over the same period. The materials inside the cells remain the bottleneck to onshoring. Domestic cathode active material capacity is projected to meet less than 7% of US storage demand by 2030, and China made 98% of the world's LFP cathode material in 2025 (per the IEA).
US lithium-ion battery imports by country, H1 2024 and H1 2026
Grid equipment
China has been a minor supplier of grid equipment, at 7% of import value in H1 2024 and 5% in H1 2026. Mexico, South Korea, and Canada supplied about 55% throughout, even as total imports grew from $4.6 billion to $7.0 billion.
The constraint is throughput. The National Laboratory of the Rockies finds that US manufacturers covered roughly 30% of domestic large power transformer demand as of 2023, and the highest grades of grain-oriented electrical steel (GOES) are about 90% imported.
Critical minerals
Import reliance runs deepest in critical minerals, and customs data doesn’t capture the full picture. Half of surveyed firms that source critical minerals report less than 25% domestic content. Because China holds roughly 90% of global rare earth refining capacity (per the IEA), a shipment declared from a third country may still contain Chinese-processed material.
Supply chain constraints and compliance are raising project costs
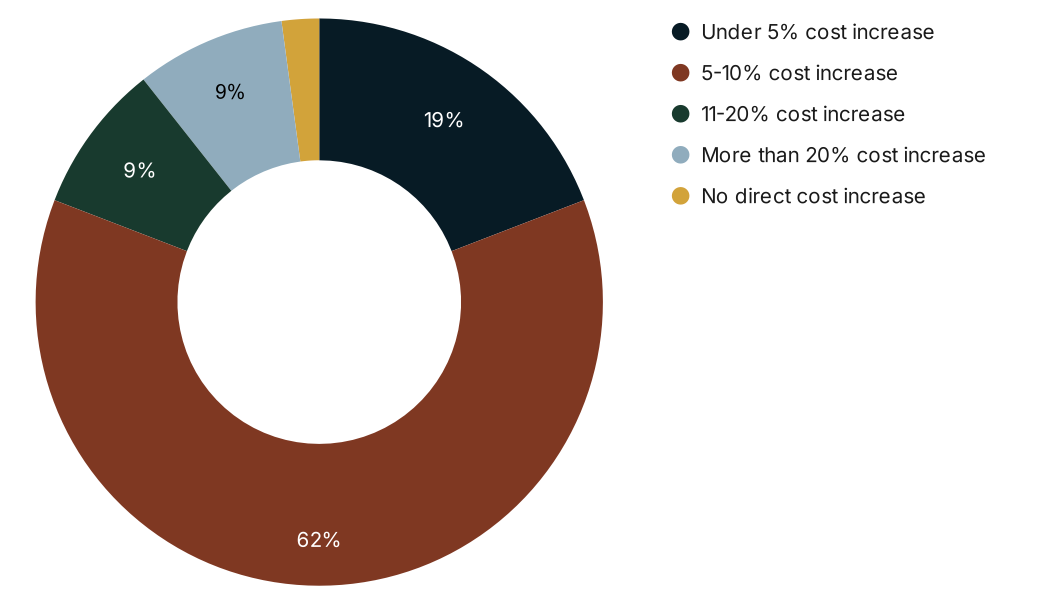
For developers and manufacturers alike, delay is now the norm. Among surveyed buyers who reported delays in the last 12 months due to supply chain constraints, roughly four in five say the delay added 5% or more to total project or production cost. Forty percent redesigned or downsized a project, and 17% canceled or indefinitely delayed one.
Costs are rising even where schedules hold. Ninety-three percent of buyers say supply chain constraints increased their input or compliance costs over the past year, and 85% of those absorbed most or part of the increase themselves.
Added project or production cost from supply chain–driven delays, share of sourcing base respondents reporting a delay, past 12 months
Compliance is a growing share of that bill. Ninety percent of buyers pay a premium for inputs that comply with prohibited foreign entity (PFE) rules: 57% pay 1–10% more, and 31% pay 11–25% more. Interviewees consistently placed the burden on verification. One industry coalition said its members are confident they are compliant but struggle to prove it to banks and lenders seeking certification for financing. A large manufacturer described operating in a "black box" while final rules remain pending.
Tariffs add to the pressure. For 89% of respondents, at least some of their most tariff-exposed inputs have no domestic substitute at a competitive price.
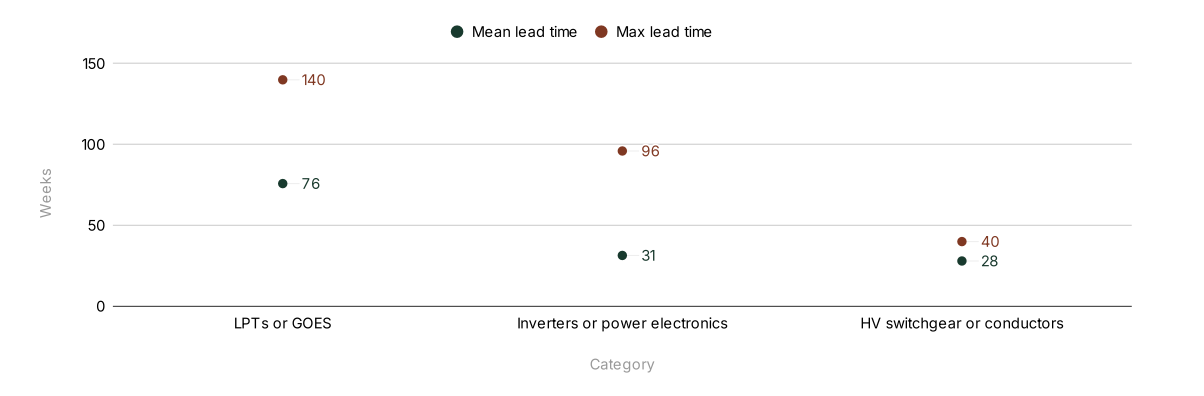
Grid equipment creates a particular challenge for independent developers. Among buyers reporting longer lead times, 49% name large power transformers or GOES as their longest-lead input, with an average wait of 76 weeks. Regulated utilities can recover costs through rate base and place reservation agreements with manufacturers. Independent power producers generally cannot, which limits their access to scarce capacity.
Lead times for grid and adjacent components from survey respondents
Industry is asking for tax incentives that reach upstream
Asked to rank policy tools for building domestic supply chains, respondents converged on manufacturing tax incentives. Eighty-seven percent placed either expanded §45X coverage or an investment tax credit (ITC) for manufacturing or refining facilities in their top three.
Respondents want both tools for different reasons. A production tax credit rewards output a plant already has, while an ITC can reach producers that have no output yet. Stakeholders said qualifying new material with a customer takes years, and access to capital during that period determines whether a new supplier can sustain operations.
Respondents' priorities for expanded §45X coverage line up with the chokepoints described above: large power transformers (44%), wafers and ingots (29%), anode active material (29%), cathode active material (28%), and GOES (24%).
Demand-side incentives shape sourcing, too. The domestic content bonuses for the clean electricity investment and production tax credits (§48E and §45Y) reward developers who build with US-made components. Only 37% of respondents plan to prioritize domestic content once the bonuses expire. Twenty-one percent expect to expand sourcing to lower-cost, non-US suppliers, and 35% say it depends on how cost-competitive domestic options are at that point.
As one cross-sector industry organization put it, "Trade restrictions work best paired with incentives, and neither works well alone."
Dates to watch
Several near-term milestones will shape costs and compliance for developers:
- Sep. 11, 2026: The US Department of Commerce issued final affirmative determinations in the Solar IV AD/CVD investigations covering India, Indonesia, and Laos. Industry expects exporters to reposition again ahead of the next case.
- November 2026: China's suspension of its expanded rare earth export controls is set to end.
- Dec. 4, 2026: Section 232 minimum import prices on polysilicon, wafers, cells, and modules take effect, along with a 15% tariff on downstream derivatives.
- Year-end 2026: The US Department of the Treasury is expected to issue additional guidance on PFE rules.
- 2030: The §45X phasedown begins. The investment decisions that will determine domestic capacity by then are being made now.
The full whitepaper covers each category in depth, including import flows, domestic capacity buildout, industry-identified constraints, and complete survey results. Download the full whitepaper.
*Unless otherwise noted, data in this article comes from Crux's whitepaper, which draws on a survey of 75 organizations, US customs data, stakeholder interviews, and third-party sources cited in the full whitepaper.
Share